How to change color of lines?
#property indicator_type1   DRAW_LINE
#property indicator_color1  clrRed,clrBlue,clrGreen,clrOrange,clrDeepPink
You are drawing a line, not a colored line. DRAW_COLOR_LINE - Indicator Styles in Examples - Custom Indicators - MQL5 Reference - Reference on algorithmic/automated trading language for MetaTrader 5
William Roeder #:
You are drawing a line, not a colored line. DRAW_COLOR_LINE - Indicator Styles in Examples - Custom Indicators - MQL5 Reference - Reference on algorithmic/automated trading language for MetaTrader 5
You are drawing a line, not a colored line. DRAW_COLOR_LINE - Indicator Styles in Examples - Custom Indicators - MQL5 Reference - Reference on algorithmic/automated trading language for MetaTrader 5
Thank you
when I apply the code, the top & bottom band don't change accordingly.
Please help again
Thanks
//+------------------------------------------------------------------+
//|                                                           BB.mq5 |
//|                   Copyright 2009-2020, MetaQuotes Software Corp. |
//|                                              http://www.mql5.com |
//+------------------------------------------------------------------+
#property copyright   "2009-2020, MetaQuotes Software Corp."
#property link        "http://www.mql5.com"
#property description "Bollinger Bands Bio"
#include <MovingAverages.mqh>
//---
#property indicator_chart_window
#property indicator_buffers 7
#property indicator_plots   3
#property indicator_type1   DRAW_COLOR_LINE
#property indicator_color1  clrRed,clrBlue,clrGreen,clrOrange,clrDeepPink
#property indicator_type2   DRAW_COLOR_LINE
#property indicator_color2  clrRed,clrBlue,clrGreen,clrOrange,clrDeepPink
#property indicator_type3   DRAW_COLOR_LINE
#property indicator_color3  clrRed,clrBlue,clrGreen,clrOrange,clrDeepPink
#property indicator_label1  "Bands middle"
#property indicator_label2  "Bands upper"
#property indicator_label3  "Bands lower"
//--- input parametrs
input int     InpBandsPeriod=20;       // Period
input int     InpBandsShift=0;         // Shift
input double  InpBandsDeviations=2.0;  // Deviation
//--- global variables
int           ExtBandsPeriod,ExtBandsShift;
double        ExtBandsDeviations;
int           ExtPlotBegin=0;
//--- indicator buffer
double        ExtMLBuffer[];
double        ExtTLBuffer[];
double        ExtBLBuffer[];
double        ExtStdDevBuffer[];

double colorBuffer1[];
double colorBuffer2[];
double colorBuffer3[];
//+------------------------------------------------------------------+
//| Custom indicator initialization function                         |
//+------------------------------------------------------------------+
void OnInit()
  {
//--- check for input values
   if(InpBandsPeriod<2)
     {
      ExtBandsPeriod=20;
      PrintFormat("Incorrect value for input variable InpBandsPeriod=%d. Indicator will use value=%d for calculations.",InpBandsPeriod,ExtBandsPeriod);
     }
   else
      ExtBandsPeriod=InpBandsPeriod;
   if(InpBandsShift<0)
     {
      ExtBandsShift=0;
      PrintFormat("Incorrect value for input variable InpBandsShift=%d. Indicator will use value=%d for calculations.",InpBandsShift,ExtBandsShift);
     }
   else
      ExtBandsShift=InpBandsShift;
   if(InpBandsDeviations==0.0)
     {
      ExtBandsDeviations=2.0;
      PrintFormat("Incorrect value for input variable InpBandsDeviations=%f. Indicator will use value=%f for calculations.",InpBandsDeviations,ExtBandsDeviations);
     }
   else
      ExtBandsDeviations=InpBandsDeviations;
//--- define buffers
   SetIndexBuffer(0,ExtMLBuffer,INDICATOR_DATA);
   SetIndexBuffer(1,colorBuffer1,INDICATOR_COLOR_INDEX);

   SetIndexBuffer(2,ExtTLBuffer,INDICATOR_DATA);
   SetIndexBuffer(3,colorBuffer2,INDICATOR_COLOR_INDEX);

   SetIndexBuffer(4,ExtBLBuffer,INDICATOR_DATA);
   SetIndexBuffer(5,colorBuffer3,INDICATOR_COLOR_INDEX);

   SetIndexBuffer(6,ExtStdDevBuffer,INDICATOR_CALCULATIONS); //Not rendered


//--- number of digits of indicator value
   IndicatorSetInteger(INDICATOR_DIGITS,_Digits+1);
  }
//+------------------------------------------------------------------+
//| Bollinger Bands                                                  |
//+------------------------------------------------------------------+
int OnCalculate(const int rates_total,
                const int prev_calculated,
                const int begin,
                const double &price[])
  {
   if(rates_total<ExtPlotBegin)
      return(0);
//--- indexes draw begin settings, when we've recieved previous begin
   if(ExtPlotBegin!=ExtBandsPeriod+begin)
     {
      ExtPlotBegin=ExtBandsPeriod+begin;
      PlotIndexSetInteger(0,PLOT_DRAW_BEGIN,ExtPlotBegin);
      PlotIndexSetInteger(2,PLOT_DRAW_BEGIN,ExtPlotBegin);
      PlotIndexSetInteger(4,PLOT_DRAW_BEGIN,ExtPlotBegin);
     }
//--- starting calculation
   int pos;
   if(prev_calculated>1)
      pos=prev_calculated-1;
   else
      pos=0;
//--- main cycle
   for(int i=pos; i<rates_total && !IsStopped(); i++)
     {
      //--- middle line
      ExtMLBuffer[i]=SimpleMA(i,ExtBandsPeriod,price);
      //--- calculate and write down StdDev
      ExtStdDevBuffer[i]=StdDev_Func(i,price,ExtMLBuffer,ExtBandsPeriod);
      //--- upper line
      ExtTLBuffer[i]=ExtMLBuffer[i]+ExtBandsDeviations*ExtStdDevBuffer[i];
      //--- lower line
      ExtBLBuffer[i]=ExtMLBuffer[i]-ExtBandsDeviations*ExtStdDevBuffer[i];

      //CHANGING COLOR
      if(i%5==0){
         colorBuffer1[i]=2;
         colorBuffer2[i]=2;
         colorBuffer3[i]=2;
      }
      else
         colorBuffer1[i]=3;
         colorBuffer2[i]=3;
         colorBuffer3[i]=3;
     }
//--- OnCalculate done. Return new prev_calculated.
   return(rates_total);
  }
//+------------------------------------------------------------------+
//| Calculate Standard Deviation                                     |
//+------------------------------------------------------------------+
double StdDev_Func(const int position,const double &price[],const double &ma_price[],const int period)
  {
   double std_dev=0.0;
//--- calcualte StdDev
   if(position>=period)
     {
      for(int i=0; i<period; i++)
         std_dev+=MathPow(price[position-i]-ma_price[position],2.0);
      std_dev=MathSqrt(std_dev/period);
     }
//--- return calculated value
   return(std_dev);
  }
//+------------------------------------------------------------------+
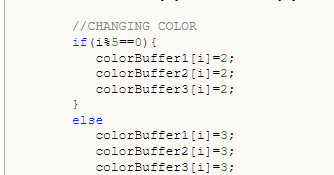
Ahh nevermind I got it
Thank you
I didn't close the ELSE properly
You are missing trading opportunities:
- Free trading apps
- Over 8,000 signals for copying
- Economic news for exploring financial markets
Registration
Log in
You agree to website policy and terms of use
If you do not have an account, please register
How do you change color of lines?
I have set 5 colors into indicator_color1,3 & 5.
Assigned INDICATOR_COLOR_INDEX after INDICATOR_DATA
When activating the indicator, the color is red instead changing blue & green.
Please advise, code is below, thank you