How to turn MT5 tick data into one second interval data?
Unfortunately, this is one of those things, that should you not have the coding skills to be able to process the data, then you are going to have to hire someone to do it for you.
Since you will be using the data for your paper trading in a spreadsheet, any programming language can be used for processing the tick data and forming 1 second OHLC bar data that you can use in your spreadsheet. You could even use Excel's own Visual Basic for Applications if you are using Excel.
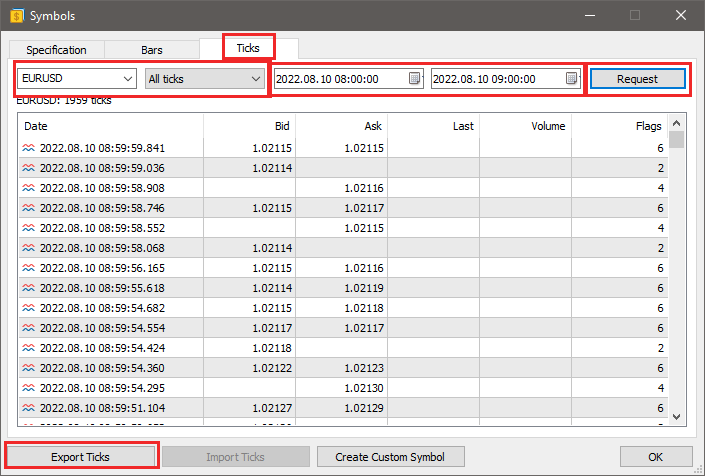
By the way, you don't need "Custom Symbols" to export tick data from MT5. Just use the Symbols (Ctrl-U) panel, select a symbol, click on the Ticks tab, select the time interval, click "Request", then "Export".
I was hoping there was a lazy way of doing it as many others would have surely walked the same path years before me but I did it myself this evening; it embarrassingly took me a couple of hours but I now have my hands on a month’s worth of tick data for GBP/USD all formatted nicely and checked, ready for tomorrow’s analysis.
I decided to break it down into individual days so your latest comment about using the symbols panel proved to be very useful, thank you for that!
CPerry.
I was hoping there was a lazy way of doing it as many others would have surely walked the same path years before me...
If anybody reading this thread wants to know what I did as my contribution, I pressed the 'Text to Columns' button on the Data tab in Excel to split the data up into multiple columns before running some code to check that a whole second had passed. If it had then a '1' appears in a new column. I then filtered on this column, formatted the time and date columns how I wanted and saved each day file within a folder for a whole month's worth of data which my modelling spreadsheet reads through one at a time.
The bit that look me ages was formatting everything to be useful for my own model. And saving, naming the files etc
If anybody has any further questions, i'm here frequently asking plenty of stupid questions myself aha so i'm happy to answer anything I can.
CPerry.
Python has a easy way to do this job, using Pandas libray.
import pandas as pd
#data = pd.read_csv([your_file_path_here], [other parameters to read the data, like data formatting, decimal, separators, header etc]).
# also you'd need to create one column for datetime (date + time)
# Check https://pandas.pydata.org/docs/reference/api/pandas.read_csv.html
# For your file, it could be something like:
data = pd.read_csv([your_file_path_here])
data['datetime'] = pd.to_datetime( data[ '<DATE>' ] + ' ' + data[ '<TIME>' ] , format='%Y.%m.%d %H:%M:%S')
PERIOD = '1s'
df_resampled = data.resample( PERIOD )
df_ohlc = df_resampled['<LAST>'].ohlc()
df_ohlc['volume'] = df_resampled['<VOLUME>'].sum()
#Then export the data in CSV
df_ohlc.to_csv([path_to_export])
I didn't test this code, so it might need some adjustments.
- pandas.pydata.org
- Free trading apps
- Over 8,000 signals for copying
- Economic news for exploring financial markets
You agree to website policy and terms of use
Hi forum,
I used custom symbols to download GBP/USD tick data in a .csv file which I have condensed and attached to this thread. I have clicked on the data tab and "Text to Columns" button on the top ribbon to split this data across several columns but now i'm stuck.
Can anybody please help me format this data into 1 second interval data and explain how to do it as I have a lot more downloaded that i'd like to format ready for analysis. I just need the: time, price, ask and bid values on a second by second basis please.
Thank you in advance for the guidance.
CPerry.