Problem using custom Indicator
check your indicator file adress and indicator buffer number in your iCustom codes.
there's nothing wrong with indicator address, the EA works without error and the buffer number is also correct both data windows and charts shows that at that datetime the indicator is bullish but when I tried to print it on strategy tester the value is different. I tried to use script and the result is the same with the chart, data window and alert window. The problem is only when I tried to print it on the strategy tester
there's nothing wrong with indicator address, the EA works without error and the buffer number is also correct both data windows and charts shows that at that datetime the indicator is bullish but when I tried to print it on strategy tester the value is different. I tried to use script and the result is the same with the chart, data window and alert window. The problem is only when I tried to print it on the strategy tester
ok then. I think you need to contact the owner of the indicator for your strategy test issue. there is nothing to do without open source codes.
- Your image is useless since you cut off the price scale.
- The buy/sell values are changing, so they are probably the red/green lines in your image. Not the blue line.
- Your image is useless since you cut off the price scale.
- The buy/sell values are changing, so they are probably the red/green lines in your image. Not the blue line.
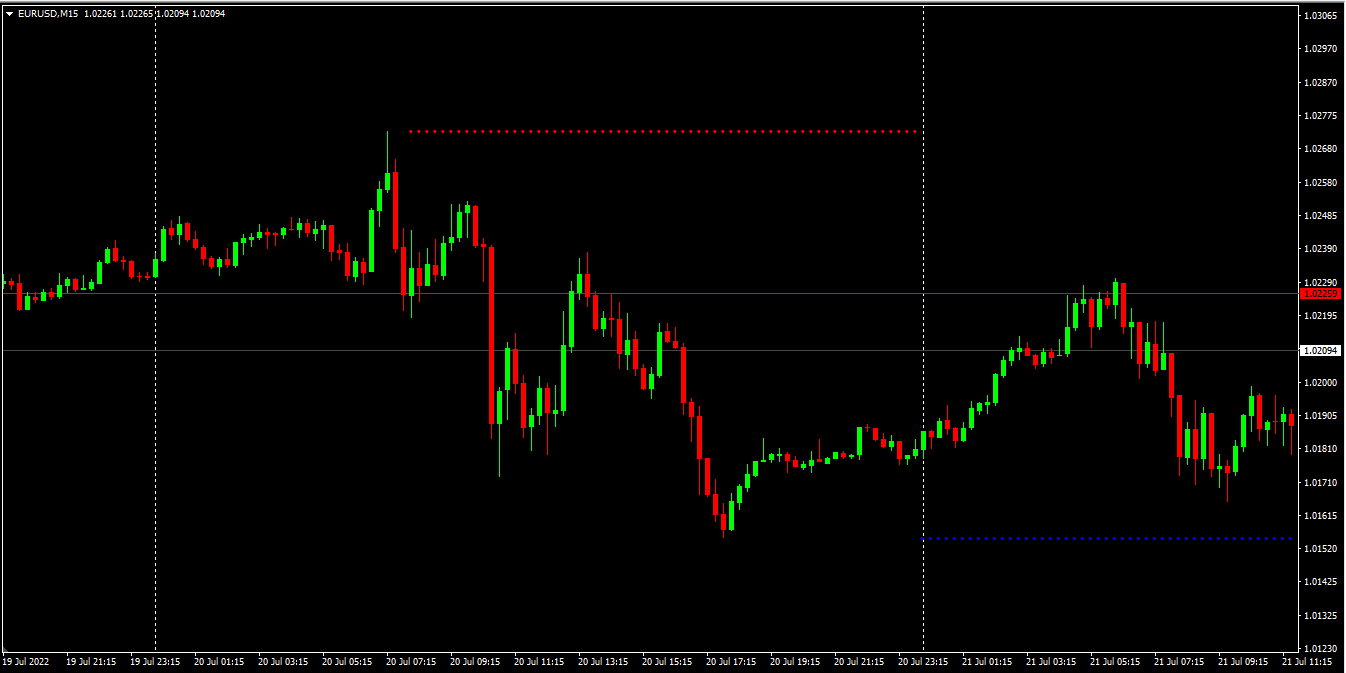
here's the full chart with price scale.
There's only 2 buffer one referring to the blue line and the other one is red line.
From the alert from this indicator, I think the problem is Candle TF setting. The alert shows that it needs more than default candle TF setting but when I tried to change it MT4 would freeze. There's nothing I can do again about it.
There was another indicator in the first picture you sent, and the buy and sell arrows on the graphic picture appeared to be in harmony with that indicator. I think you are trying to define some things as mixed.
There was another indicator in the first picture you sent, and the buy and sell arrows on the graphic picture appeared to be in harmony with that indicator. I think you are trying to define some things as mixed.
- Free trading apps
- Over 8,000 signals for copying
- Economic news for exploring financial markets
You agree to website policy and terms of use
Hi everyone, I have this indicator that I want to used in my EA. I found it doesn't works cohesively between the value on the chart and on the strategy tester.
this is screenshot from my chart, the blue line on the bottom is the indicator that I mentioned. In this chart the indicator shows bull trend but when I pull the value from it I found that the value indicates bear trend and not bull.
from 16:00 it shows the value of bear trend while the indicator shows bull.
This is my code to refer to the indicator value.
Can anyone help me to check whether the indicator that faulty.
Thank you.