still a newbie please need Coding Help.
- Seleucus: . I have attached some code of how far i went.
You didn't go anywhere; there is no code to detect your want, no code to draw a rectangle, etc.
- Seleucus: whenever a fair value gap is detected .
Until you can state your requirements in concrete terms, it can not be coded.
- Seleucus: if the high of a candle at index 1 is longer than the low of candle at index 3A high / low of a candle is a price. It is not a distance. There is no “longer.” № 2.
-
You didn't go anywhere; there is no code to detect your want, no code to draw a rectangle, etc.
-
Until you can state your requirements in concrete terms, it can not be coded.
- A high / low of a candle is a price. It is not a distance. There is no “longer.” № 2.
Seleucus #: I just need some guidance regarding how to copy the high and low prices of the bars in Oncalculate function
The code I included, I know it isn't much but what I wanted was to get feedback if I'm on the right track.
-
You have the high and low arrays in the function. Set them to as-series and just read the values. Why do you need to copy? What's the problem?
To define the indexing direction in the time[], open[], high[], low[], close[], tick_volume[], volume[] and spread[] arrays, call the ArrayGetAsSeries() function. In order not to depend on defaults, call the ArraySetAsSeries() function for the arrays to work with.
Event Handling / OnCalculate - Reference on algorithmic/automated trading language for MetaTrader 5 -
Right track for what? All you posted was the initial template for an indicator; you haven't coded anything yet.
- Free trading apps
- Over 8,000 signals for copying
- Economic news for exploring financial markets
You agree to website policy and terms of use
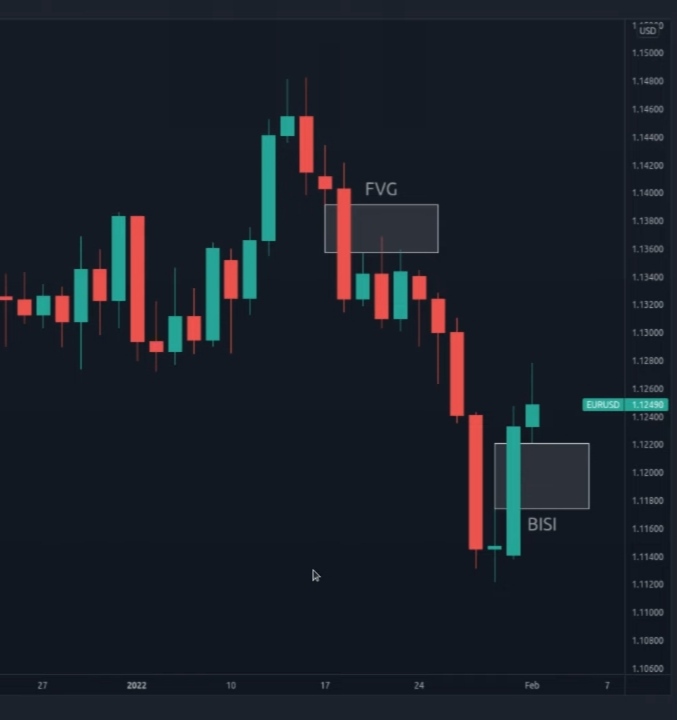
I am trying to come up with an indicator that draws a rectangle on chart whenever a fair value gap is detected .
its based on the ICT trading concepts for those who are familiar with it. I want to draw a rectangle in between the 3 bars if the high of a candle at index 1 is longer than the low of candle at index 3 and vice versa for buy side fair value gap. So to my understanding i would need 2 buffers , one for low price values and high price values and i will need two indicator plots to draw the rectangle. I have tried to read documentation but im still confused on how to proceed. i have also tried to follow youtube videos but then in the the videos the custom indicators they are creating are based on inbuilt technical indicators yet what i want to do is based purely on price action on the chart so it was so confusing trying to understand and follow their steps. Especially how to copy highs and lows for the specific bars on the Oncalculate function. please advise what resources may help me for my exact scenario or just advise what i should be doing instead . I have attached some code of how far i went. Not very far lol