How to overlay Histogram plots in DRAW_HISTOGRAM2
Note: Just look - you are trying to combine two indicators in one window that have VERY DIFFERENT MEASUREMENT SCALE!
Here is the error:
//--- Set an empty value
   PlotIndexSetDouble(0,PLOT_EMPTY_VALUE,0);
Appreciate the heads up on the scale mixup and the PlotEmpty declaration Vladimir(The latter I used because the examples in documentation had it though it seemed illogical to me too).
I have however only managed to display the filtered ADX bar values on the histogram. Despite making the 2nd buffer use the same static value that falls in the range of the ADX values, I cannot see the histogram bars mapped to the second buffer(That should cover the indexes at which the 1st ADX buffer has value zero).
Here is my modified mql5 file.
//+------------------------------------------------------------------+
//|                                                  ll.mq5 |
//|                                  Copyright 2022, MetaQuotes Ltd. |
//|                                             https://www.mql5.com |
//+------------------------------------------------------------------+
#property copyright "Copyright 2022, MetaQuotes Ltd."
#property link      "https://www.mql5.com"
#property version   "1.00"
#property strict

#property indicator_separate_window
#property indicator_buffers 4
#property indicator_plots   1
//--- plot Histogram_2
#property indicator_label1  "Histo"
#property indicator_type1   DRAW_HISTOGRAM2
#property indicator_color1  clrRed
#property indicator_style1  STYLE_SOLID
#property indicator_width1  1
//+------------------------------------------------------------------+
//| Custom indicator initialization function                         |
//+------------------------------------------------------------------+
double Awesome_Buffer[];
double Awesome_Intermediate_Buffer[];

double ADX_Buffer[];
double ADX_Intermediate_Buffer[];

int adx_period=20;
int bars_calculated=0;
int handle, adx_handle;
//+------------------------------------------------------------------+
//|                                                                  |
//+------------------------------------------------------------------+
int OnInit()
  {
//--- indicator buffers mapping
   SetIndexBuffer(0,ADX_Buffer,INDICATOR_DATA);
   SetIndexBuffer(1,ADX_Intermediate_Buffer,INDICATOR_CALCULATIONS);
   SetIndexBuffer(2,Awesome_Buffer,INDICATOR_DATA);
   SetIndexBuffer(3,Awesome_Intermediate_Buffer,INDICATOR_CALCULATIONS);
//--- Set an empty value

//   PlotIndexSetDouble(0,PLOT_EMPTY_VALUE,0);
//---
   handle=iAO(_Symbol,_Period);
   adx_handle=iADX(_Symbol,_Period,adx_period);
   return(INIT_SUCCEEDED);
  }
//+------------------------------------------------------------------+
//| Custom indicator iteration function                              |
//+------------------------------------------------------------------+
int OnCalculate(const int rates_total,
                const int prev_calculated,
                const datetime &time[],
                const double &open[],
                const double &high[],
                const double &low[],
                const double &close[],
                const long &tick_volume[],
                const long &volume[],
                const int &spread[])
  {
   if(prev_calculated<=0)
     {
      ArrayInitialize(Awesome_Buffer,0);
      ArrayInitialize(Awesome_Intermediate_Buffer,0);
      ArrayInitialize(ADX_Buffer,0);
      ArrayInitialize(ADX_Intermediate_Buffer,0);
     }

   handleValuesToBuffer(handle,prev_calculated, rates_total,Awesome_Intermediate_Buffer);
   handleValuesToBuffer(adx_handle,prev_calculated,rates_total,ADX_Intermediate_Buffer);

//--- Calculate the indicator values
   int start=0;
//--- If already calculated during the previous starts of OnCalculate
   if(prev_calculated>0)
      start=prev_calculated-1;

   for(int i=start; i<rates_total; i++)
     {
      //PrintFormat("Awesome vals %g , ADX Vals %g",Awesome_Intermediate_Buffer[i],ADX_Intermediate_Buffer[i]);
      ADX_Buffer[i]=ADX_Intermediate_Buffer[i]>20?ADX_Intermediate_Buffer[i]:0;
      Awesome_Buffer[i]=ADX_Buffer[i]==0?20:0;
     }


//--- return value of prev_calculated for next call
   return(rates_total);


  }
//+------------------------------------------------------------------+
int handleValuesToBuffer(const int indi_handle,const int prev_calculated,const int rates_total,double &destBuffer[])
  {

//--- number of values copied from the iMA indicator
   int values_to_copy;
//--- determine the number of values calculated in the indicator
   int calculated=BarsCalculated(indi_handle);
   if(calculated<=0)
     {
      PrintFormat("BarsCalculated() returned %d, error code %d",calculated,GetLastError());
      return(0);
     }

//--- if it is the first start of calculation of the indicator or if the number of values in the iMA indicator changed
//---or if it is necessary to calculated the indicator for two or more bars (it means something has changed in the price history)
   if(prev_calculated==0 || calculated!=bars_calculated || rates_total>prev_calculated+1)
     {
      //--- if the iMABuffer array is greater than the number of values in the iMA indicator for symbol/period, then we don't copy everything
      //--- otherwise, we copy less than the size of indicator buffers
      if(calculated>rates_total)
         values_to_copy=rates_total;
      else
         values_to_copy=calculated;
     }

   else
     {
      //--- it means that it's not the first time of the indicator calculation, and since the last call of OnCalculate()
      //--- for calculation not more than one bar is added
      values_to_copy=(rates_total-prev_calculated)+1;
     }

   CopyBuffer(indi_handle,0,0,values_to_copy,destBuffer);

//--- memorize the number of values in the Moving Average indicator
   bars_calculated=calculated;

   return 0;
  }
//+------------------------------------------------------------------+
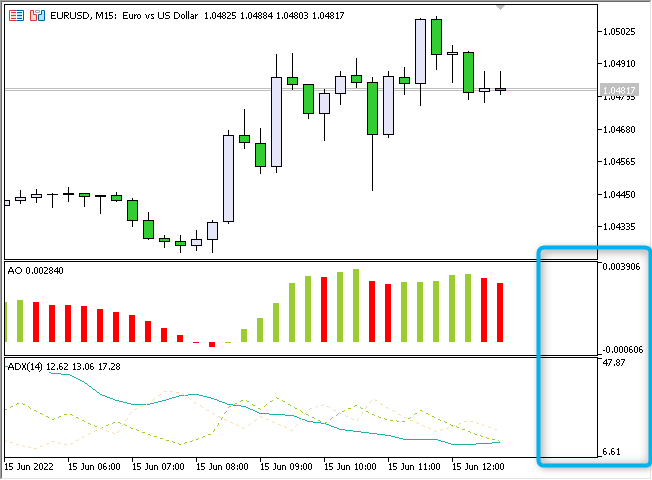
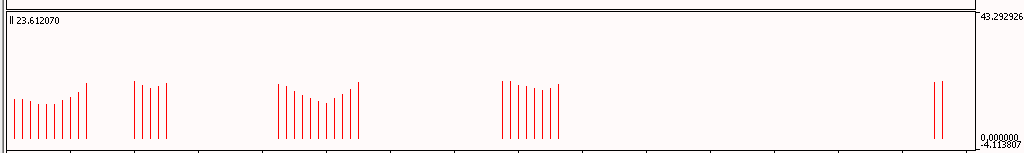
And here is a pic showing the output currently.
You must remove zero:
PlotIndexSetDouble ( 0 , PLOT_EMPTY_VALUE , EMPTY_VALUE );
And all the same - you make a mistake and do not read what I am writing to you:
Forum on trading, automated trading systems and testing trading strategies
How to overlay Histogram plots in DRAW_HISTOGRAM2
Vladimir Karputov, 2022.06.15 11:40
Note: Just look - you are trying to combine two indicators in one window that have VERY DIFFERENT MEASUREMENT SCALE!
PlotIndexSetDouble(0,PLOT_EMPTY_VALUE,EMPTY_VALUE);
However I still have the same Issue with the 2nd buffer values not being displayed, in the latest code above I had set the second buffer values to all 20 so to simulate them falling within the ADX scale which seems to be somewhere between 0 and 60 for this case. Ideally, The second buffer should then have visible bars in places where the 1st buffer has intermediate values less than 20. Here is that code in onCalculate()
   for(int i=start; i<rates_total; i++)
     {
      //PrintFormat("Awesome vals %g , ADX Vals %g",Awesome_Intermediate_Buffer[i],ADX_Intermediate_Buffer[i]);
      ADX_Buffer[i]=ADX_Intermediate_Buffer[i]>20?ADX_Intermediate_Buffer[i]:0;
      Awesome_Buffer[i]=ADX_Buffer[i]==0?20:0;
     }
I'm still getting the same issue on the subwindow though, only the ADX(Index 0) buffer values are displayed, I hope I have clarified more and please correct in case I've misunderstood.
As suggested, I have uncommented the code and written in the form you had meant
However I still have the same Issue with the 2nd buffer values not being displayed, in the latest code above I had set the second buffer values to all 20 so to simulate them falling within the ADX scale which seems to be somewhere between 0 and 60 for this case. Ideally, The second buffer should then have visible bars in places where the 1st buffer has intermediate values less than 20. Here is that code in onCalculate()
I'm still getting the same issue on the subwindow though, only the ADX(Index 0) buffer values are displayed, I hope I have clarified more and please correct in case I've misunderstood.
You don't read at all. Please read a hundred times:
Forum on trading, automated trading systems and testing trading strategies
How to overlay Histogram plots in DRAW_HISTOGRAM2
Vladimir Karputov, 2022.06.15 11:40
Note: Just look - you are trying to combine two indicators in one window that have VERY DIFFERENT MEASUREMENT SCALE!
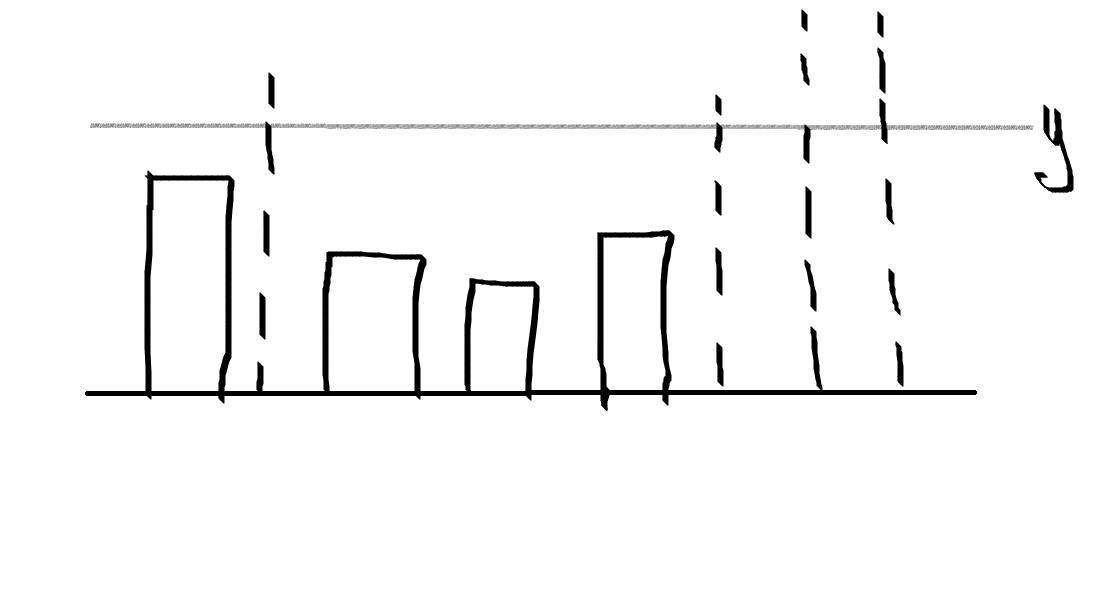
I think it would be best to abstract this then, since I am pretty sure I have attempted to bridge the divide caused by the indicators, I will infact not be using the actual indicator values in the final version. What I needed to know was, Is it possible to achieve bars on a histogram with different line styles via 2 buffers on the same histogram indicator plot..just like in mql4. Here is a sketch showing a case of what I would like to achieve, can we have different line bars for instance for values above (y) in the histogram scale. And how might we achieve this, is my Histogram2 approach in the right direction?
I think it would be best to abstract this then, since I am pretty sure I have attempted to bridge the divide caused by the indicators, I will infact not be using the actual indicator values in the final version. What I needed to know was, Is it possible to achieve bars on a histogram with different line styles via 2 buffers on the same histogram indicator plot..just like in mql4. Here is a sketch showing a case of what I would like to achieve, can we have different line bars for instance for values above (y) in the histogram scale. And how might we achieve this, is my Histogram2 approach in the right direction?
You cannot mix two styles within the same 'plot'.
Wow then this is a step back, In mql4 this could be achieved just like I was trying, using 2 buffers each having different styles overlaid on each other. Is there any way you may know of differentiating the histogram bars in mql5 apart from using different colors?
Please read the documentation: Indicator Styles in Examples

- www.mql5.com
- Free trading apps
- Over 8,000 signals for copying
- Economic news for exploring financial markets
You agree to website policy and terms of use
Hi community. I would like to have a 2 buffer histogram on a separate chart so that I can display bars with 2 types of styling from the 2 buffers. In reality, only one bar will be displayed at a time for an index as one of them will have a zero value for that index. This is just like how it would be achieved in mql4.
On mql5 I am however getting a blank subwindow or having the adx buffer values shifted up, the latter which makes me wonder if there's an implication that the 2 sinusoid/bars cannot be plotted on the same zero/origin line? Attached is my code, thank you.