Ideas for volatility
Unfortunately, when it comes to coding, pictures are "worthless" and words don't help much either.
You will have to clearly define what you mean by "volatility" in terms of clear logical and mathematical expressions, before you can even begin to code such a filter for your trading conditions.
Unfortunately, when it comes to coding, pictures are "worthless" and words don't help much either.
You will have to clearly define what you mean by "volatility" in terms of clear logical and mathematical expressions, before you can even begin to code such a filter for your trading conditions.
THank you Fernando
Coding is not a problem.
Why do Asian open first 1 hour candle get to have high volatility and sometimes it does'nt? is it influenced by preceding data or candles? can it be predicted?
by high volatility I mean if the first 1 hour candle's range is 60% or more than the preceding candle's range.
I don't want to re invent a wheel.
I have tried comparing the average range of the last x number of preceding candles for scenarios where there's high volatility with those without, but I'm not getting consistence results.
No, obviously the high volatility of the 1st hour of the Asian session, is because it is the opening bell and liquidity is low at that time. It's a question of human psychology, nothing more.
Can you predict it? Yes! It's the opening bell and liquidity is low. Assume that it will always be the case.
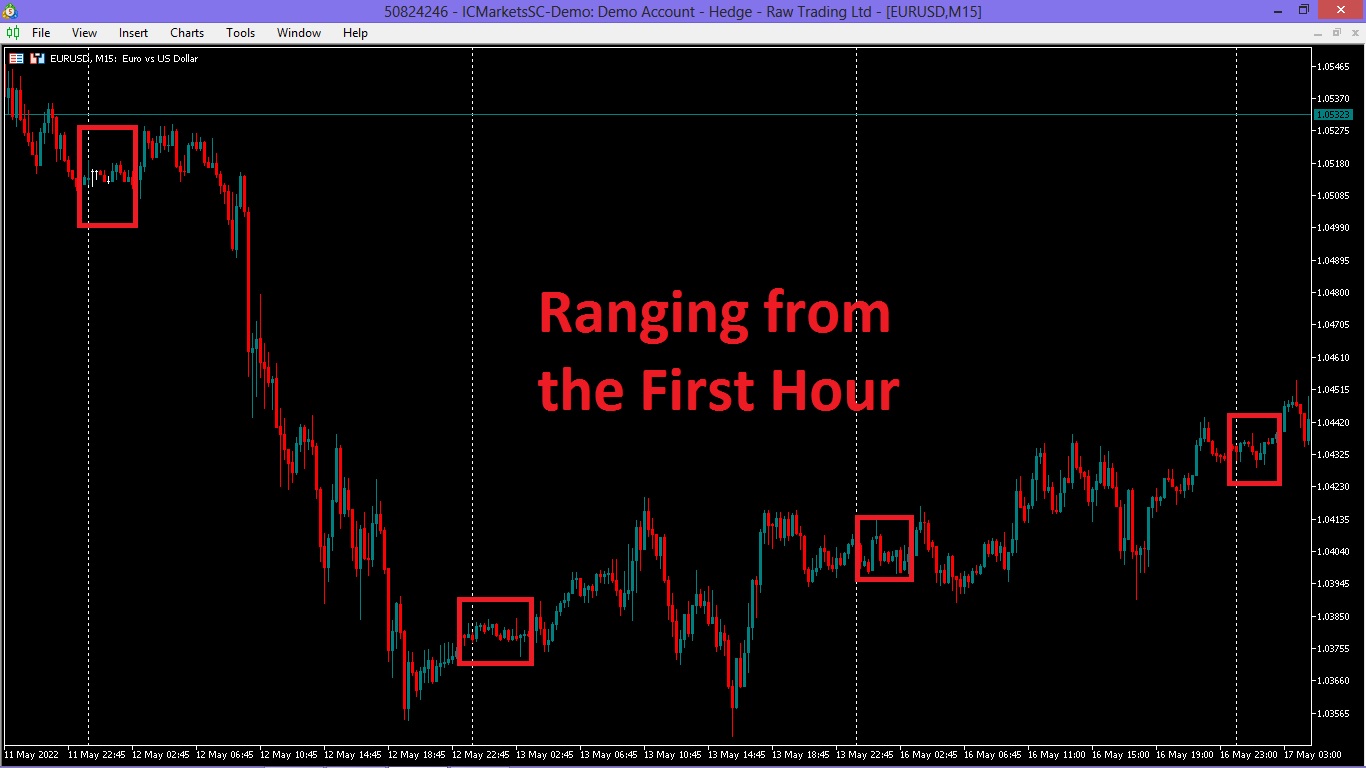
Most of the time, the volatility is low, in fact, 90% of the time volatility begin from the second hour, it rarely begin from hour 0. It will range for an hour before the daily close and an hour after daily open.
With my GMT +3 charts, range normally begin from 22:00, 2 hours before daily close and ends at 01:00, an hour after daily open.
This is why I thought maybe there's something that might influence the change of this pattern, Volatility beginning from hour 00:00. Before I spend time searching for it, I hoped maybe it's already known fact and can be forecasted. Or maybe someone can point me to an article maybe I can read that explain the daily close and opening range pattern.
Well, then look to your own evaluation to describe your threshold for the code. How are YOU as the trader evaluate the setup to decide if it is volatile or not?
Are you looking at the tick volume, or the price range over several bars, or the deviation from a moving average, etc?
Write these observations down, and define them in a clear, precise, logical way, so that you can implement them in your code.
For now I have looked at the preceding range, perhaps if the average range for x amount of bars is less than 200 points, then volatility will begin early from hour 00:00, I got non consistent results. I have looked at deviations from a moving average too using Standard deviation indicator with no positive results.
Perhaps if I can learn the logic behind the pause in volatility during the first hour of daily open. I understand why volatility is low during the daily close. During New York Open for example, at 16:00, volatility just pick up without a preceding range, I understand that it is because London is still open. But why there's a range during daily open? perhaps Sydney or Tokyo actually start an hour after the daily candle has open? or perhaps Sydney alone have low liquidity which then pickup when Tokyo opens an hour later? or I'm just clueless and there's a logical explanation
New York session closes at 20:00 GMT
Sydney session open at 22:00 GMT
What is going during the 2 hours in between???
On my GMT +3 charts, that's from 23:00 until 01:00 GMT+3.
- Free trading apps
- Over 8,000 signals for copying
- Economic news for exploring financial markets
You agree to website policy and terms of use
Hello to everyone
I'm looking for ideas on how I can go about on trying to workout probabilities of high volatility Asian Open vs low volatility. Pictures speak louder than words, so I have attached two pictures on what I'm trying to do.
I want to avoid low volatility open