From theory to practice - page 204
You are missing trading opportunities:
- Free trading apps
- Over 8,000 signals for copying
- Economic news for exploring financial markets
Registration
Log in
You agree to website policy and terms of use
If you do not have an account, please register
Still very old, but I think interesting information regarding the receipt of ticks before processing.
https://www.mql5.com/ru/forum/102066/page9
With this post I bow low to the mathematicians.
Look at the probability distributions of time intervals (in seconds) between real tick quotes.
For the AUDCAD pair:
For the AUDCHF pair:
I dare say that when the number of accepted ticks increases to 1,000,000, the values of the probability density function (the "Probability" column) will be almost the same.
Hypothesis - we have just the forex market time scale in front of us. Work (receive data, make calculations) must be performed on this time scale, not on the uniform or exponential one.
Please help me determine the analytical formula for the probability density function of this distribution! And as a consequence - the formula for the generator of random numbers of this distribution.
Regards,
Alexander_K
The distribution of incremental velocities: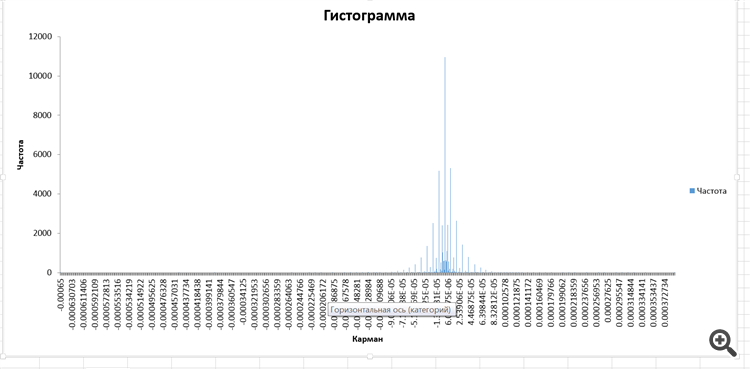
I have no idea what it is. But, interesting.
The distribution of incremental velocities:
I have no idea what it is. But, interesting.
It looks like a two-sided exponential with discontinuity noise.
Laplace distribution
...
Please help me determine the analytical formula for the probability density function of this distribution! And as a consequence, the formula for the random number generator of this distribution.
Regards,
Alexander_K
Simulation of random variable with specified distribution law
Alexander, please send me the raw data and I will try to find a distribution.
Hi Denis.
The columns are named on Sheet 2 to make it clearer.
The distribution of incremental velocities:
I have no idea what it is. But, interesting.
It looks like a two-sided exponential with discontinuity noise.
Laplace distribution.
Nope, no way - it's not the Laplace distribution, nor is it a one-sided geometric distribution.
I thought it was this one:
with the formula:
but, it didn't fit...
With this post I bow low to the mathematicians.
Look at the probability distributions of time intervals (in seconds) between real tick quotes.
For the AUDCAD pair:
For the AUDCHF pair:
I dare say that when the number of accepted ticks increases to 1,000,000, the values of the probability density function (the "Probability" column) will be almost the same.
Hypothesis - we have just the forex market time scale in front of us. Work (receive data, make calculations) must be performed on this timescale, and not on the uniform or exponential one.
Please help me determine the analytical formula for the probability density function of this distribution! And as a consequence - the formula for the generator of random numbers of this distribution.
Regards,
Alexander_K
There is a hypothesis: "there are fewer ticks at night and more ticks during the day, so the price can travel more in a minute during the day and less at night" which is true if we assume that the price always travels approximately the same distance per tick.
You'd better measure the average distance a price travels per tick for different times of day.