You are missing trading opportunities:
- Free trading apps
- Over 8,000 signals for copying
- Economic news for exploring financial markets
Registration
Log in
You agree to website policy and terms of use
If you do not have an account, please register
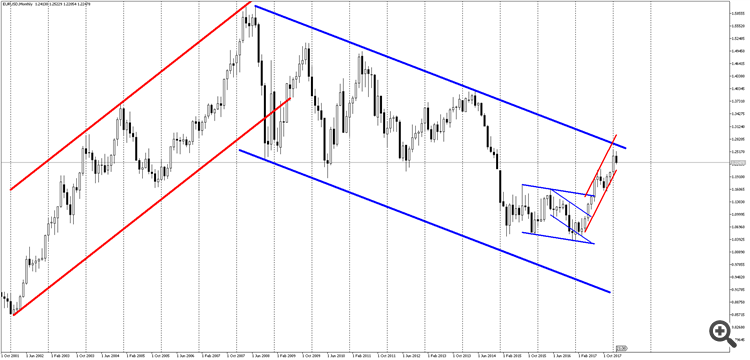
Euro, Trends on the Global scale.
I have marked on the chart all the Trends, at least in the Global Downtrend
If we remove all unnecessary (already worked out), then we are left with the following Trends, one Global Downtrend (thick blue line), and in it an Intermediate Trend (red), which tends to approach the Trend line

*Trend(Trend): ascending: each successive Top and Trough is higher than the previous one, descending: each successive Top and Trough is lower than the previous one.Uptrend, each successive Top and Trough is higher than the previous one, Downtrend, it's the other way round.
Uptrend, each successive Top and Trough is higher than the previous one, Downtrend, it's the other way round.
It's almost like that.
It's almost like that.
The trend is unreliable and can change at any time, while trading requires a Tvh, which should have a stop loss, which can in turn be linked to a profit and get the risk/profit, which ideally should be large (1 to 3 or higher).
Uptrend, each successive Top and Trough is higher than the previous one, Downtrend, it's the other way round.
The main thing here is to define what a top and trough are, in a more formalised way.
And this will be tied to a specific TF at least, i.e. tied to scalability (for wave directors - to a wave level), without it the trend definition would be vague.
Then the definition of the trend will involve appealing to a specific chart scale, or scale relations. And from here you have to keep building it further.
It seems to be clear on the chart, but we come up against the notion of "the subsequent top - well, this is when the price went down in I do not know how many points and by how many candlesticks, and then went up in I do not know how many points and by how many candlesticks, it did not break the previous top, and it went further below the previous bottom in I do not know how many points and by how many candlesticks".
The trend is defined more formally at one well-known Forex academy. The definition there is as follows:
A trend is a movement from FZR to FZR.
FZR is a fractal-zigzag reversal. (As you can see from the name, it is a combination of readings of two indicators: fractal and zigzag).
But, on sluggishly rising markets or sharp movements, the FZR doesn't come out, or it is difficult to understand, it is not.
The main thing here is to define what is a peak and trough in a more formalized way.
And this will be tied to a specific TF at least, i.e. tied to scalability (for wave directors - to a wave level), without it the trend definition would be vague.
Then the definition of the trend will involve appealing to a specific chart scale, or scale relations. And from here you have to keep building it further.
It seems to be clear on the chart, but we come up against the notion of "the subsequent top - well, this is when the price went down in I do not know how many points and by how many candlesticks, and then went up in I do not know how many points and by how many candlesticks, it did not break the previous top, and it went further below the previous bottom in I do not know how many points and by how many candlesticks".
The trend is defined more formally at one well-known Forex academy. The definition there is as follows:
A trend is a movement from FZR to FZR.
FZR is a fractal-zigzag reversal. (As you can see from the name, it is a combination of readings of two indicators: fractal and zigzag
But, on sluggishly rising markets or sharp movements, the FZR doesn't come out, or it is difficult to understand, it is not.
In this case the tops and troughs have to be sorted out using fractals... If an extremum is visible at one timeframe and not at a lower one, it cannot be taken into account and there is no binding to any single timeframe, i.e. it is more natural to consider tops and troughs.
In this case the tops and troughs have to be sorted out using fractals... If on one time frame an extremum is visible and not on a smaller one, it simply cannot be taken into account and there is no binding to only one time frame, i.e. it is more natural to consider tops and troughs.
Another variant is formation and simultaneous processing of LOCAL and CONNECTED trends...
In this case the tops and troughs have to be sorted out using fractals... If an extremum is visible at one timeframe and not at a lower one, it cannot be taken into account and there is no binding to any single timeframe, i.e. it is more natural to consider tops and troughs.
Then what is an extremum? It is understood as "a candle to the left and to the right of which all the candles are higher/lower than it", in other words it is a fractal.
A fractal is related to a certain TF.
If we understand it as "a quote on the chart to the left and to the right of which all the quotes are higher/lower than it".
Then we have a vague definition: the number of quotations is not specified and everyone will see different extremums.
There is also the option of forming and processing LOCAL and COUNTRY trends simultaneously...
We have not yet defined what a trend is
How do you define it for yourself? If you already have types of trends...