Any questions from newcomers on MQL4 and MQL5, help and discussion on algorithms and codes - page 1042

 
Добрый день. Прошу помощи. Уже пару недель безуспешно пытаюсь заставить индикатор круглых уровней заставить (см.код) передавать их для использования в эксперте через iCustom. Прошу помочь поправить код.


#property indicator_chart_window

extern string H                     = " --- Mode_Settings ---";
extern bool   Show_00_50_Levels     = true;
extern bool   Show_20_80_Levels     = true;
extern color  Level_00_Color        = Lime;
extern color  Level_50_Color        = Gray;
extern color  Level_20_Color        = Red;
extern color  Level_80_Color        = Green;

double dXPoint = 1;
double Div = 0;
double i = 0;
double HighPrice = 0;
double LowPrice = 0;
int iDigits;
  
int start() 
{
   HighPrice = MathRound((High[iHighest(NULL, 0, MODE_HIGH, Bars + 300, 2)]+1) * Div);
   LowPrice = MathRound((Low[iLowest(NULL, 0, MODE_LOW, Bars + 300, 2)]-1) * Div);
  
  if(Show_00_50_Levels)
  {
   for (i = LowPrice; i <= HighPrice; i++) 
   {
      if (MathMod(i, 5) == 0.0) {
         if (ObjectFind("RoundPrice " + DoubleToStr(i, 0)) != 0) {
            ObjectCreate("RoundPrice " + DoubleToStr(i, 0), OBJ_HLINE, 0, Time[1], i / Div);
            ObjectSet("RoundPrice " + DoubleToStr(i, 0), OBJPROP_STYLE, STYLE_DOT);
            if(MathMod(i, 10) == 0.0)
            {
            ObjectSet("RoundPrice " + DoubleToStr(i, 0), OBJPROP_COLOR, Level_00_Color);
            }
            else
            {
            ObjectSet("RoundPrice " + DoubleToStr(i, 0), OBJPROP_COLOR, Level_50_Color);
            }
         }
      }
   }
   
  }
  
  if(Show_20_80_Levels)
  {
  
   for (i = LowPrice; i <= HighPrice; i++) 
   {
         
        if (StringSubstr(DoubleToStr(i/Div,iDigits), StringLen(DoubleToStr(i/Div,iDigits))-2, 2)=="20") {
         if (ObjectFind("RoundPrice " + DoubleToStr(i, 0)) != 0) {
            ObjectCreate("RoundPrice " + DoubleToStr(i, 0), OBJ_HLINE, 0, Time[1], i / Div);
            ObjectSet("RoundPrice " + DoubleToStr(i, 0), OBJPROP_STYLE, STYLE_DOT); 
            ObjectSet("RoundPrice " + DoubleToStr(i, 0), OBJPROP_COLOR, Level_20_Color);
            
            }
         }
        
         
         if (StringSubstr(DoubleToStr(i/Div,iDigits), StringLen(DoubleToStr(i/Div,iDigits))-2, 2)=="80") {
         if (ObjectFind("RoundPrice " + DoubleToStr(i, 0)) != 0) {
            ObjectCreate("RoundPrice " + DoubleToStr(i, 0), OBJ_HLINE, 0, Time[1], i / Div);
            ObjectSet("RoundPrice " + DoubleToStr(i, 0), OBJPROP_STYLE, STYLE_DOT);
           
            ObjectSet("RoundPrice " + DoubleToStr(i, 0), OBJPROP_COLOR, Level_80_Color);
            }
         }
         
   }
   
  }
  
   return (0);
}

int init() 
{
   iDigits = Digits;
   if(Digits==5 || Digits==3)dXPoint=10;
   if(Digits==3)  iDigits=2;
   if(Digits==5)  iDigits=4;
   
   Div = 0.1 / (Point*dXPoint);
   return (0);
}

int deinit()
{
   HighPrice = MathRound((High[iHighest(NULL, 0, MODE_HIGH, Bars + 300, 2)]+1) * Div);
   LowPrice = MathRound((Low[iLowest(NULL, 0, MODE_LOW, Bars + 300, 2)]-1) * Div);
   for (i = LowPrice; i <= HighPrice; i++) ObjectDelete("RoundPrice " + DoubleToStr(i, 0));
   return (0);
 
Aleksey Mavrin:
If you say that you are practically zero at programming, then why are you taking on such non-standard tasks, maybe you should start with simple ones? Or improve your knowledge of the basics? It's easier to get it done for you, yeah.

I didn't write: "Make me an indicator". I asked for help. I have never had the goal to master mql4 completely. I'm just checking the ideas. I have already had enough of excel).

 
Oleg Bondarev:

I warned you that I was a "hacker")

Here's how I did it.

Now it draws a tick chart, but there are some line breaks.

I do it in 4.

Broken lines means that there are no values in Label1Buffer[ХХХ].

and the second, I wrote above, one more time - the indicator buffer (Label1Buffer) is controlled by the terminal, if you see a new bar, the values will all shift automatically - run the code on M1 and observe

ZS: not a hacker, but someone who is trying to learn on his own! ))))

 
Igor Makanu:

broken lines means that there are no values in the Label1Buffer[XXX]

and the second, I wrote above, one more time - the indicator buffer (Label1Buffer) is controlled by the terminal, if a new bar appears, then the values will all shift automatically - run the code on M1 and observe

ZS: not a hacker, but someone who is trying to learn on his own! ))))

Label1Buffer[XXX] - does it mean 3 composite number?


Oleg Bondarev:

Label1Buffer[XXX] - is this a 3-component number?


No, I wrote the first letters I remembered.

that's the number of the item.

look at your code, you wrote your code similarly to my loop, where you shift the indicator buffer Label1Buffer by one element - notice every indicator call (every tick)

and after you shift the contents of the Label1Buffer, assign thenew value to Label1Buffer[0]

and what values will be in other elements? at first launch they will have "empty value" (EMPTY_VALUE), then you shift them once and assign a new value to.... and then the terminal itself will shift ALL valuesof Label1Buffer when a new bar appears


In general, there is a slight shift in your knowledge, but try to simply draw the closing price of the bar with the indicator, here is the code

#property indicator_separate_window
#property indicator_buffers 1
#property indicator_plots   1
//--- plot line1
#property indicator_label1  "line1"
#property indicator_type1   DRAW_LINE
#property indicator_color1  clrRed
#property indicator_style1  STYLE_SOLID
#property indicator_width1  1
//--- input parameters
input int      Input1=10;
//--- indicator buffers
double         line1Buffer[];
//+------------------------------------------------------------------+
//| Custom indicator initialization function                         |
//+------------------------------------------------------------------+
int OnInit()
  {
//--- indicator buffers mapping
   SetIndexBuffer(0,line1Buffer);
   IndicatorDigits(Digits);
   
//---
   return(INIT_SUCCEEDED);
  }
//+------------------------------------------------------------------+
//| Custom indicator iteration function                              |
//+------------------------------------------------------------------+
int OnCalculate(const int rates_total,
                const int prev_calculated,
                const datetime &time[],
                const double &open[],
                const double &high[],
                const double &low[],
                const double &close[],
                const long &tick_volume[],
                const long &volume[],
                const int &spread[])
  {
//---
  int i,limit;
//--- Первый вызов индикатора или смена таймфрейма или подгрузка данных из истории
   if(prev_calculated==0){
      limit=rates_total-1;
   }else
      limit=rates_total-prev_calculated+1; // или limit=rates_total-prev_calculated ; чтобы не перерисовывать бар №1
//--- Основной цикл расчета
//Print("limit = ",limit);
   for(i=limit; i>=0; i--){
      line1Buffer[i]=close[i];
    }
//---
  return(rates_total);

  }
//+------------------------------------------------------------------+
 
I hear you. I'll have to think about it. Thank you!
 

How to record data in Excel? - MQL5.

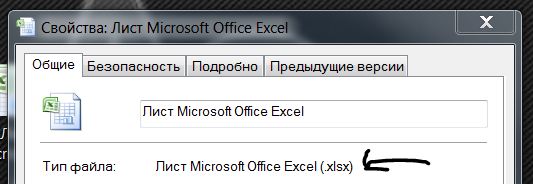
The Excel file format is xlsx, but the FileOpen function creates and works with txt and csv files.


I need to unload the data from the buffers after testing in OnTester that contain the history of different data at the moment of opening of each tick and output the data of all deals in one chart
As you understand the data will be a lot even for one trade, not to mention all of them - that's why the option "manually transfer" is not suitable


What do you recommend?

 
Alexandr Sokolov:

How to import data into Excel? - MQL5.

The Excel file format is xlsx and the FileOpen function creates and works with txt and csv files.


I need after testing in OnTester to unload the data from buffers that contain history of different data at moment when position was opened on each tick, and then display all trades data on one chart
As you understand the data will be a lot even for one trade, not to mention all of them - so the option of "manually transferring" is not suitable


What do you recommend?

Well, the bottom line is simple - you can't write directly to Excel using MQL5, but you can import data from a text file in Excel under "data" >>> "from text" tab.

 
Hello, I get an error about unsuccessful objects after completing an explorer test, and I have created absolutely all the objects, as far as I understand, in the stack, i.e. without new. Please explain this issue.
 
Alexandr Sokolov:

What do you recommend?

Write in .csv and open in Excel

Reason: