How to get the maximum and minimum price from a vertical line,
I told you to wait for the moderator to move your topic. Now you are double posting which is against forum rules. I also gave you an answer there.
Forum on trading, automated trading systems and testing trading strategies
How to get the maximum and minimum price from a vertical line,
Fernando Carreiro, 2022.04.27 18:58
Wait for moderator to move it for you!
I think you misunderstand my query, I don't need the value of a vertical line, what I need is how to get the High[ ] of a bar or Low[ ] of a bar from an object or Vline
- There is no value of a VLine, only the time.
- Get the time. Get the bar index of that time. Get the High or Low of that index. What's the problem?
No it's not deleted. You only made it worse and made a mess of it of it all.
And you also ignored my answer, but that is no longer my concern.
Forum on trading, automated trading systems and testing trading strategies
Fernando Carreiro, 2022.04.27 19:02
Don't put such functionality in the OnInit() event handler. During the OnInit() event, data has still not settled. In fact, it may not even exist yet.
Only collect the symbol data in either the OnCalculate() for Indicators, or OnTick() for Expert advisors.
Excuse me but my English is not very good and it is not understood, I have a vertical line on the chart and I want to obtain, taking as reference that vertical line towards the candle (0) on the left, the maximum value and the minimum value of the chart and Once I have that data I will make a line from those two points, see image.
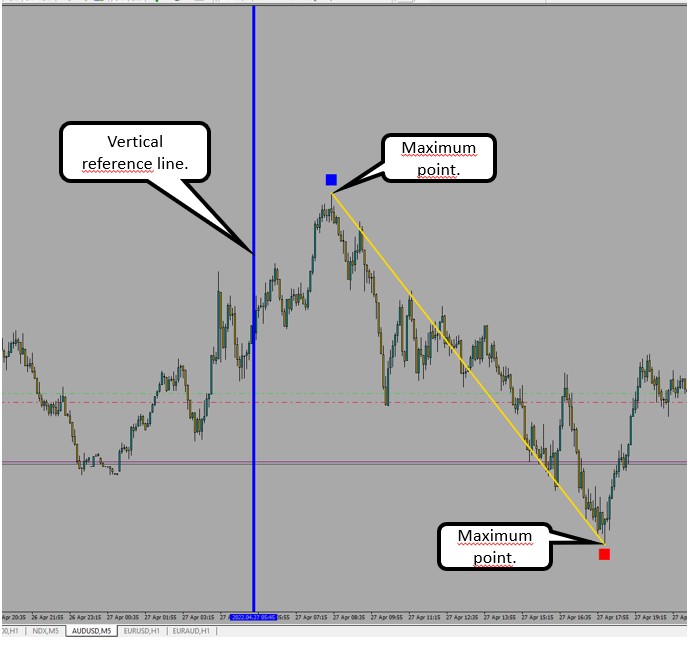
Excuse me but my English is not very good and it is not understood, I have a vertical line on the chart and I want to obtain, taking as reference that vertical line towards the candle (0) on the left, the maximum value and the minimum value of the chart and Once I have that data I will make a line from those two points, see image.
To answer your question:
int  iHighest(
   string           symbol,          // symbol
   int              timeframe,       // timeframe
   int              type,            // timeseries
   int              count,           // count
   int              start            // start
  );
int  iLowest(
   string           symbol,          // symbol
   int              timeframe,       // timeframe
   int              type,            // timeseries id
   int              count,           // count
   int              start            // starting index
  );
One thing to note is that it checks from right to left.
So if start=4 and count=10, it will look from index 4,5,6,7...13.
If I recall correctly, you can set a negative value for count and it will check from left to right.
Example:
//--- Obtain the index of the highest high from index 4 to index 1
const int highestHighIndex = iHighest(NULL, 0, MODE_HIGH, 4, 1);
//--- Use that index to obtain the value of the high
const double highestHigh   = High[highestHighIndex];

Print("The Highest High between index 1 and index 4 is: ", DoubleToStr(highestHigh, Digits));

Excuse me but my English is not very good and it is not understood, I have a vertical line on the chart and I want to obtain, taking as reference that vertical line towards the candle (0) on the left, the maximum value and the minimum value of the chart and Once I have that data I will make a line from those two points, see image.
//+------------------------------------------------------------------+
//|                                                             i.mq |
//+------------------------------------------------------------------+
#property copyright "2022"
#property version   "1.01"
#property strict
#property indicator_chart_window
#property indicator_buffers 0
#property indicator_plots   0

input color  UpColor   = clrDeepSkyBlue;
input color  DnColor   = clrRed;
input color  LineColor = clrGold;

//+------------------------------------------------------------------+
//| Custom indicator initialization function                         |
//+------------------------------------------------------------------+
void OnInit()
{
  SetVLine(0,"MVS_Start", iTime(_Symbol,0,10), 0, 1, clrBlue);
}
//+------------------------------------------------------------------+
//|                                                                  |
//+------------------------------------------------------------------+
void OnDeinit(const int reason)
{
  ObjectsDeleteAll(0,"MVS_");
  ChartRedraw();
}
//+------------------------------------------------------------------+
//| Accumulation/Distribution                                        |
//+------------------------------------------------------------------+
int OnCalculate(const int rates_total,
                const int prev_calculated,
                const datetime &time[],
                const double &open[],
                const double &high[],
                const double &low[],
                const double &close[],
                const long &tick_volume[],
                const long &volume[],
                const int &spread[])
{
  return(rates_total);
}
//+------------------------------------------------------------------+
//|                                                                  |
//+------------------------------------------------------------------+
void OnChartEvent(const int id,
                  const long &lparam,
                  const double &dparam,
                  const string &sparam)
{
  double low[],high[];
  datetime time[];
  double min=0,max=0;
  datetime TimeDn=0,TimeUp=0;
  int Imin,Imax;

  datetime y1=(datetime)ObjectGetInteger(0,"MVS_Start",OBJPROP_TIME);
  datetime y2=TimeCurrent();
  int cLow=CopyLow(_Symbol,0,y1,y2,low);
  int cHigh=CopyHigh(_Symbol,0,y1,y2,high);
  datetime cTime=CopyTime(_Symbol,0,y1,y2,time);
  if(cLow<1 || cHigh<1 || cTime<1) return;
  Imin=ArrayMinimum(low);
  min=low[Imin];
  Imax=ArrayMaximum(high);
  max=high[Imax];
  TimeDn=time[Imin];
  TimeUp=time[Imax];
  //
  SetArrow(0,"MVS_minA", TimeDn, min, DnColor, 110, 1, ANCHOR_TOP, false);
  SetArrow(0,"MVS_maxA", TimeUp, max, UpColor, 110, 1, ANCHOR_BOTTOM, false);
  SetTLine(0,"MVS_line", TimeDn, min, TimeUp, max, STYLE_SOLID, 1, LineColor);

}

//+------------------------------------------------------------------+
//|                                                                  |
//+------------------------------------------------------------------+
void SetVLine(long chart_ID,string nm, datetime t1=0, int st=0, int wd=1,color cl=clrRed)
{
  if(ObjectFind(chart_ID,nm)<0) {
    ObjectCreate(chart_ID,nm,OBJ_VLINE,0,0,0);
    ObjectSetInteger(chart_ID,nm,OBJPROP_STYLE,st);
    ObjectSetInteger(chart_ID,nm,OBJPROP_WIDTH,wd);
    ObjectSetInteger(chart_ID,nm,OBJPROP_SELECTABLE,true);
    ObjectSetInteger(chart_ID,nm,OBJPROP_SELECTED,true);
    ObjectSetInteger(chart_ID,nm,OBJPROP_HIDDEN,false);
    ObjectSetInteger(chart_ID,nm,OBJPROP_BACK,false);
    ObjectSetInteger(chart_ID,nm,OBJPROP_TIME,t1);
    ObjectSetInteger(chart_ID,nm,OBJPROP_COLOR,cl);
  }
}
//+------------------------------------------------------------------+
//|                                                                  |
//+------------------------------------------------------------------+
void SetTLine(long chart_ID,string nm,datetime t1=0,double p1=0,datetime t2=0,double p2=0,int st=0,int wd=1,color cl=clrRed)
{
  if(ObjectFind(chart_ID,nm)<0) {
    ObjectCreate(chart_ID,nm,OBJ_TREND,0,0,0,0);
    ObjectSetInteger(chart_ID,nm,OBJPROP_RAY,false);
    ObjectSetInteger(chart_ID,nm,OBJPROP_STYLE,st);
    ObjectSetInteger(chart_ID,nm,OBJPROP_WIDTH,wd);
    ObjectSetInteger(chart_ID,nm,OBJPROP_SELECTABLE,false);
    ObjectSetInteger(chart_ID,nm,OBJPROP_SELECTED,false);
    ObjectSetInteger(chart_ID,nm,OBJPROP_HIDDEN,false);
    ObjectSetInteger(chart_ID,nm,OBJPROP_BACK,false);
    ObjectSetInteger(chart_ID,nm,OBJPROP_TIME,t1);
    ObjectSetDouble(chart_ID,nm,OBJPROP_PRICE,p1);
    ObjectSetInteger(chart_ID,nm,OBJPROP_TIME,1,t2);
    ObjectSetDouble(chart_ID,nm,OBJPROP_PRICE,1,p2);
    ObjectSetInteger(chart_ID,nm,OBJPROP_COLOR,cl);
    ObjectSetString(chart_ID,nm,OBJPROP_TOOLTIP,"\n");
    ChartRedraw(chart_ID);
  }
  ObjectSetInteger(chart_ID,nm,OBJPROP_TIME,t1);
  ObjectSetDouble(chart_ID,nm,OBJPROP_PRICE,p1);
  ObjectSetInteger(chart_ID,nm,OBJPROP_TIME,1,t2);
  ObjectSetDouble(chart_ID,nm,OBJPROP_PRICE,1,p2);
}
//+------------------------------------------------------------------+
//|                                                                  |
//+------------------------------------------------------------------+
void SetArrow(long chart_ID,string nm="",datetime t1=0,double p1=0,color col=clrRed,int code=252,
              int width=1,ENUM_ARROW_ANCHOR anchor=0,bool sel=false)
{
  if(ObjectFind(chart_ID,nm)<0) {
    ObjectCreate(chart_ID,nm,OBJ_ARROW,0,0,0);
    ObjectSetInteger(chart_ID,nm,OBJPROP_COLOR,col);
    ObjectSetInteger(chart_ID,nm,OBJPROP_ARROWCODE,code);
    ObjectSetInteger(chart_ID,nm,OBJPROP_ANCHOR,anchor);
    ObjectSetInteger(chart_ID,nm,OBJPROP_WIDTH,width);
    ObjectSetInteger(chart_ID,nm,OBJPROP_SELECTABLE,sel);
    ObjectSetInteger(chart_ID,nm,OBJPROP_SELECTED,false);
    ObjectSetInteger(chart_ID,nm,OBJPROP_BACK,false);
    ObjectSetInteger(chart_ID,nm,OBJPROP_HIDDEN,false);
    ChartRedraw(chart_ID);
  }
  ObjectSetDouble(chart_ID,nm,OBJPROP_PRICE,p1);
  ObjectSetInteger(chart_ID,nm,OBJPROP_TIME,t1);
}
//+------------------------------------------------------------------+
OKAY!
Many thanks to both Vitaly Muzichenko and Alexander Martinez.
I'm going to try it.
All the best
Hi Vitaly!
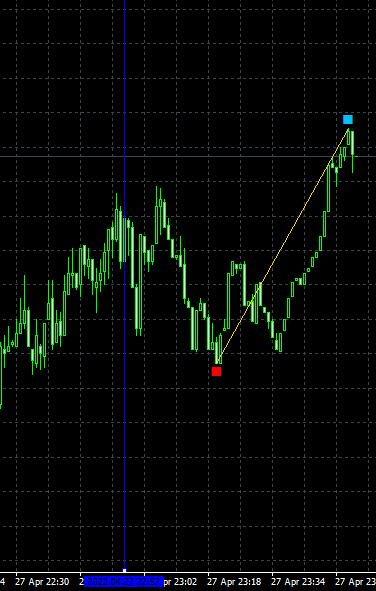
Thank you very much for the code. I've tried it and it's perfect. Vitaly I have looked at myself and studied your code and there is part that I don't know what it does, would you be so kind as to explain to me what it does to learn it better?
Thank you very much in advance and forgive my English.
if(cLow<1 || cHigh<1 || cTime<1) return;
  Imin=ArrayMinimum(low);
  min=low[Imin];
  Imax=ArrayMaximum(high);
  max=high[Imax];
  TimeDn=time[Imin];
  TimeUp=time[Imax];
I think I know all the "if" functions but this "if" with the "return" and the rest confuses me and I don't know if it's part of the "if" or not.
All the best
- Free trading apps
- Over 8,000 signals for copying
- Economic news for exploring financial markets
You agree to website policy and terms of use
For an indicator that I am doing, I need the mql4 comman or code to obtain the maximum and minimum price from a vertical line, I know how to do it from the window but not from a vertical line, can someone help me. attached code so far?.