Gunn, astromechanics. Forecasts, discussion - page 48
You are missing trading opportunities:
- Free trading apps
- Over 8,000 signals for copying
- Economic news for exploring financial markets
Registration
Log in
You agree to website policy and terms of use
If you do not have an account, please register
This is according to Mixona's theory, it was he who suggested that this is the place to start. First you need to find out where and at what degree this one (high or low) is in the annual cycle.
I don't know what he was saying there in my excel, I don't use ganzila, but what will it give you, you want to trade on global trends, on eur it will be problematic, it has been rising almost all the time.
I have the option of thinking on screenshots, otherwise you can talk for a long time without understanding what it's all about.
This is the look of all the squares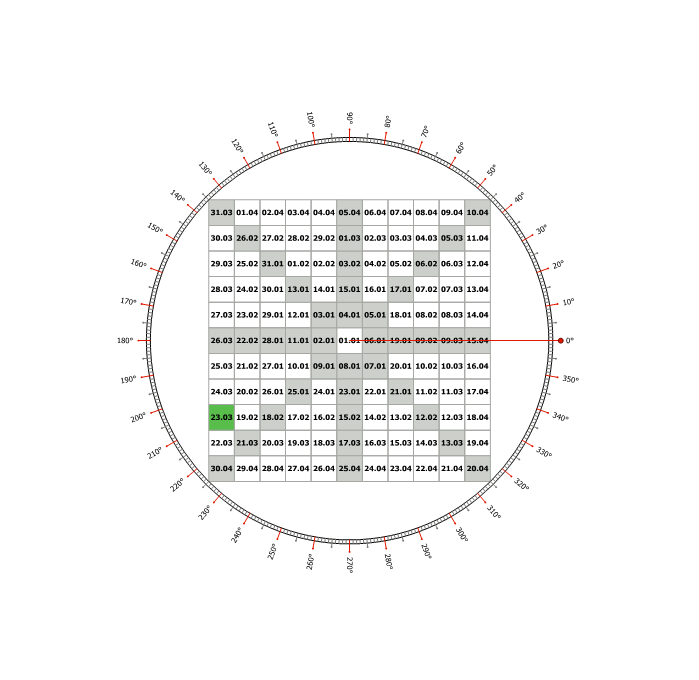
Let's take it as a base and move on.
We have three points:
Low - 07.06.2010
High - 21.06.2010
Low - 29.06.2010
Question: What will be the next high?
According to history it is 06.08.2010
But why?
We have three points:
Low - 07.06.2010
High - 21.06.2010
Low - 29.06.2010
Question: What will be the next high?
According to the history it is 06.08.2010
But why?
by the square.
on the square.
Why not 10.07.2010?
by the square.
Why else not 10.07.2010 ?
OK, let's say the answer is: because on 10.07.2010 there was no high, which means we are going for the next spiral, and that's where we are on 06.08.2010.
Then let's move on.
Now we take the high of 21.06.2010 as a reference point.
We have a low on the 29.06.2010 and a high on the 06.08.2010.
The question: where will be the next low?
The answer:
24.08.2010
It all makes sense, it's all great, and the story matches.
Then we take the low of 29.06.2010 as a starting point.
We have a high on 06.08.2010 and a low on 24.08.2010
Question: Where will be the next high?
The answer is: 04.09.2010
Since 04.09.2010 is a weekend, it will be 03.09.2010
Oh well... history has this high too...