EURUSD - Trends, Forecasts and Implications (Part 3) - page 377
You are missing trading opportunities:
- Free trading apps
- Over 8,000 signals for copying
- Economic news for exploring financial markets
Registration
Log in
You agree to website policy and terms of use
If you do not have an account, please register
Yes, basic thesis.... don't listen to anyone....))))
I should try it... in case I get younger )))....
The price stands like a bound, shit, I see that the structure is not complete, it needs to go up, but it's the last one, it may stay like that, or on the contrary, it may rush. Can't see what is forming. Very weather it is a zig-zag on the day, and a little left, and if not....)))) Dialectic....))))
Have you read Sun Tzu's The Art of War?
No, I've heard it, but I haven't read it.
No, I've heard of it, but I haven't read it.
Read it, it's great stuff. It is applicable to both business and forex. If you understand this book, you won't get discouraged.
He's got his own book, The Way of the Wave.
He has his own book The Wave Path
I don't work in waves, but sometimes out of curiosity I look at the weekly forecast from UMIS, here:
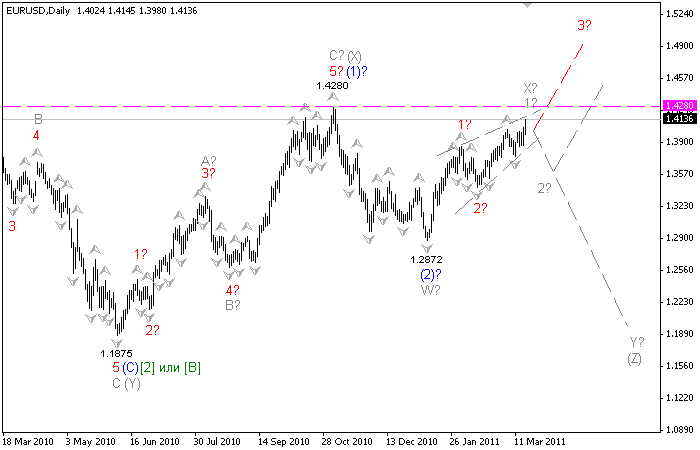
The overview wave picture is shown in Fig. 1.

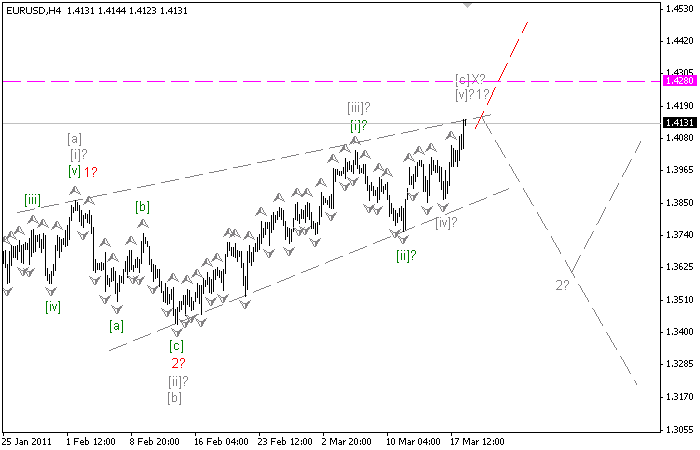
Fig. 1. Wave pattern of the daily chart.The most relevant remains the main variant, according to which the correction [2] or [B] is completed, and at the moment there is a big impulse development [3] or [C], and it has completed waves (1) and (2) and the formation of wave (3) has started. There are two possibilities within the formation of wave (3). The first one implies completion of waves (1), (2) and formation of wave (3). The second one assumes the fact that wave 1, which has taken the form of an initial triangle, is only being completed at the moment. At the same time, until the price has passed the final level of wave (1), the alternative remains in force, which implies the continuation of the development of wave [2] or [B], which in this case will take the form of a triplet (on the chart in gray), and it probably completes the X wave of the second triplet (Z). Let's look at the details on the four-hour chart (Fig. 2).

Fig. 2. Waveform breakdown of the four-hour chart.The development of wave 3 of impulse (3) has probably started. At the same time it has formed waves [i], [ii] and started the development of wave [iii]. This option will be confirmed in case of continuation of dynamic growth and a break above the end level of wave (1). At the same time, it is possible that at the moment the formation of wave 1 is only being completed, and correction 2 will begin in the near future. Such a move might also correspond to the main alternative, according to which wave X is now completed, after which the transition to a decline in Y is expected. The main alternative will be confirmed in case the price moves below the end of wave (2). Clarification of the wave pattern is expected in the near term.
I don't work on waves, but sometimes out of curiosity I look at the weekly forecast from UMIS, here:
I don't work in waves, but sometimes out of curiosity I look at weekly forecast from UMIS, here:
I don't see more than 2 waves either (1 up - 2 down)...but there are people chopping normally on waves...
screenshots are interesting ... don't understand only red is it alternate or main?
He's got his own book, The Way of the Wave.
You make fun of him in vain. It really can, and should, be read.