You are missing trading opportunities:
- Free trading apps
- Over 8,000 signals for copying
- Economic news for exploring financial markets
Registration
Log in
You agree to website policy and terms of use
If you do not have an account, please register
Why cut out parts of the indicator if the market is closed for some instrument? Let it draw a straight line (last price).
This is the point - it is not a straight line (last price) that is drawn, - but this place is skipped at all on this instrument and it turns out that charts are shifted incorrectly on the history or do not show the same thing at all:
And the further into the depths - the worse! - Instead of a "gap" at the beginning of each trading day, this gap in the history is shifted deeper into the day:
OK, thank you. I'll give it a try, too.
And what concerns iBarShift(), - I should be very careful, because I'm just now beginning to think - what's the situation in
iBarShift(Symbol_2,Period(),iTime(Symbol_1,Period(),k),true);- is not the same as -
iBarShift(Symbol_1,Period(),iTime(Symbol_2,Period(),k),true);
gap indicator of the main EUROPE stock indices Germany-England-France-Italy
a gaps indicator for the major US stock market indices S&P500 NASDAQ DJIA
grain break indicator maize - soybeans MEAL - soybeans BEANS - wheat
meat gap indicator: pork - beef (perhaps it was this correlation that served to develop the B. scandal)
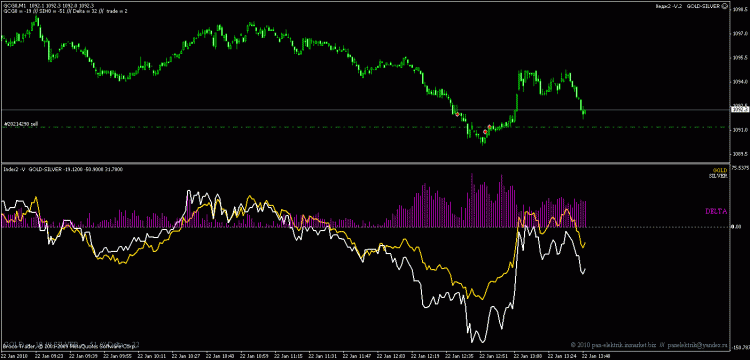
new improved version of the GOLD-SILVER gap indicator
- solved the problem of "weights" of instruments, earlier there were significant errors.
- added a visual histogram of delta in balanced pips.
- added visual levels for market entry delta1, delta2 etc.
there are expert advisors for this indicator, please contact me in private.

20211467 2010.01.22 11:10 buy 0.10 gcg0 1097.2 0.0 0.0 2010.01.22 11:16 1096.8 -1.00 0.00 0.00 -4.0020211468 2010.01.22 11:10 sell 0.20 sih0 17.500 0.000 0.000 2010.01.22 11:16 17.485 -2.00 0.00 0.00 15.00
20211766 2010.01.22 11:25 buy 0.40 sih0 17.460 0.000 0.000 2010.01.22 11:26 17.465 -4.00 0.00 0.00 10.00
20211767 2010.01.22 11:25 sell 0.40 gcg0 1095.8 0.0 0.0 2010.01.22 11:26 1095.8 -4.00 0.00 0.00 0.00
20211829 2010.01.22 11:27 sell 0.40 gcg0 1095.9 0.0 0.0 2010.01.22 11:49 1095.5 -4.00 0.00 0.00 16.00
новая доработанная версия индикатора разрывов ЗОЛОТО - СЕРЕБРО
- решена проблема "весов" инструментов, ранее были существенные погрешности.
- добавлена визуальная гистограмма дельты в уравновешенных пунктах.
- добавлены визуальные уровни для входа в рынок дельта1, дельта2 и т.д.
по данному индикатору имеются советники, обращайтесь в личку
20211467 2010.01.22 11:10 buy 0.10 gcg0 1097.2 0.0 0.0 2010.01.22 11:16 1096.8 -1.00 0.00 0.00 -4.0020211468 2010.01.22 11:10 sell 0.20 sih0 17.500 0.000 0.000 2010.01.22 11:16 17.485 -2.00 0.00 0.00 15.00
20211766 2010.01.22 11:25 buy 0.40 sih0 17.460 0.000 0.000 2010.01.22 11:26 17.465 -4.00 0.00 0.00 10.00
20211767 2010.01.22 11:25 sell 0.40 gcg0 1095.8 0.0 0.0 2010.01.22 11:26 1095.8 -4.00 0.00 0.00 0.00
20211829 2010.01.22 11:27 sell 0.40 gcg0 1095.9 0.0 0.0 2010.01.22 11:49 1095.5 -4.00 0.00 0.00 16.00
In a five-digit DC A... silver line (white) is at zero - practically a horizontal straight line.