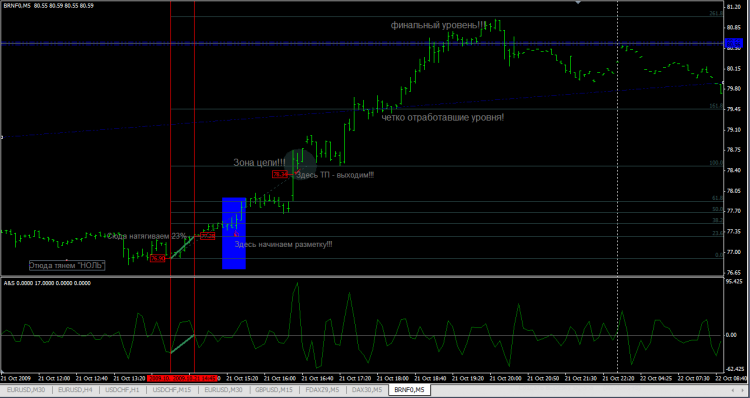
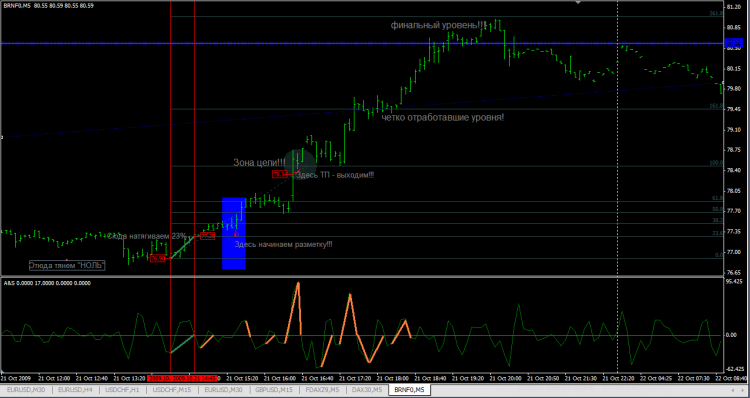
It has long been my practice to use the Fibonacci pattern as a target for price movement. The idea is not complicated and is taken from the physical laws of motion of a body: if a body with a certain mass is given some acceleration, it is possible to predict the way and speed of this movement (displacement) by taking into account all vectors of forces applied to this body and constructing the resulting vector.
In our case, the price has moved 27 pips from the reversal point during 90 minutes. Below is the acceleration indicator with a period of 2 bars, which gives me information about the pauses of the movement and its strength.
On the line "A" the price made the last spike from the previous movement and turned around - it was the peak of negative acceleration according to the indicator. Further the price moved towards the direction we are considering. On the vertical line "B" the acceleration of the price movement has fallen to zero - a pause! This pause is the anchor point of our forecast. It indicates the strength of the movement, i.e. the price overcoming some distance takes efforts that can be measured and predict its further behavior. According to the horizontal Fibonacci drawing, the first pause (consolidation, accumulation ...) from the movement start is located at the level of 23% of the movement. Now, from the point of the previous reversal on the line "A", we stretch "Fibo" lines so that the 23.6% line gets to the bar on the line "B", presumably to the middle of the bar, because we don't know in what place this bar was the real "zero" on the indicator ... that's it! ... Now the 100% mark of the "Fibo" lines indicates the price at which the strength of the initial movement will end.
The key point in your idea is to identify the reversal. It is not a problem to write an Expert Advisor, but here is the eternal question: where do I start drawing from? I propose to formalize the reversal conditions
Here I like clinging to the tops, of course everything seems cool, but in reality guessing at... indicators. I can't see a bullet in the forehead. Please tell me more about the characteristic of point A ? From other points A1-Ap. The method may be good but it won't work on its own.
First of all I don't see a formalised TC here, just pretty pictures. .Of course, the author now seems to think it all works... He's seen a few pretty moments and that's it. In fact, it's all nonsense, as there is no idea here, the market is not described by one physical law of body movement, as the author wrote.
Unfortunately he also takes advantage of it.
... Gentlemen, it doesn't take much intelligence to identify the previous reversal around the blue square... that's the first thing...
... Second: yes, I've been using it for quite some time, that's why I decided to put the algorithm out there ...
... Third: lovers of tongue scratching - leave this topic. I will not take part in the discussion of market behavior and laws - there is enough verbiage on the forum anyway.
... Fourthly: If necessary, I will occasionally post current forecasts, but I don't see the point in doing so ... I don't plan to post proofs of the algorithm. If anyone became interested in the technology - please be welcome with questions, with constructive questions on the methodology of application ...
Firstly I don't see a formalized TS here, only beautiful pictures ... Of course, the author now seems to think that it all works ... He's seen a few pretty moments and that's it. Actually it's all nonsense as there is no idea, the market is not described by one physical law of motion of a body as the author wrote.
... it's been tested for about half a year... and please, no statements! ... It's exhausting to be unambiguous!
Victor, it's not exactly an Expert Advisor, the question is a simple indicator ... which you should first study on history ... To make it a multitime one and display all variants of predictions on the chart. It's a simple matter, as Stepan Demura says - "God hasn't cancelled the feed yet" ...
- Free trading apps
- Over 8,000 signals for copying
- Economic news for exploring financial markets
You agree to website policy and terms of use


In our case, the price has moved 27 pips from the reversal point during 90 minutes. Below is the acceleration indicator with the period of 2 bars, which gives me information about the pauses of the movement and its strength.
On the line "A" the price made the last spike from the previous movement and turned around - it was the peak of negative acceleration according to the indicator. Further the price moved towards the direction we are considering. On the vertical line "B" the acceleration of the price movement has fallen to zero - a pause! This pause is the anchor point of our forecast. It indicates the strength of the movement, i.e. the price overcoming some distance takes efforts that can be measured and predict its further behavior. According to the horizontal Fibonacci drawing, the first pause (consolidation, accumulation ...) from the movement start is located at the level of 23% of the movement. Now, from the point of the previous reversal on the line "A", we stretch "Fibo" lines so that the 23.6% line gets to the bar on the line "B", presumably to the middle of the bar, because we don't know in what place this bar was the real "zero" on the indicator ... that's it! ... Now the 100% mark of the "Fibo" lines indicates the price, at which the strength of the initiated movement will end.
Forecast markup