I will write the indicator for free - page 41
You are missing trading opportunities:
- Free trading apps
- Over 8,000 signals for copying
- Economic news for exploring financial markets
Registration
Log in
You agree to website policy and terms of use
If you do not have an account, please register
Hello, I cannot beat the indicator that if the MACD is below zero on several TFs or above zero on all TFs, it will show on every bar where the condition is met.
I have sketched it here but it does not work as planned. I thank you in advance.
If you haven't figured it out yet
Hello, I cannot beat the indicator that if the MACD is below zero on several TFs or above zero on all TFs, it will show on every bar where the condition is met.
I have sketched it here but it does not work as planned. I thank you in advance.
What was wrong? )))
Then it goes something like this
Yuri, how difficult is it to implement the approach (see description below and picture) to create an indicator?
We need an indicator that shows the distance between points on the timeframe that is specified on the chart, the value of which will be either a histogram or as a line
in this case (see formula below):
x=time it will be the same for both symbols
y=the price value at the moment when the candle opened or closed (either better)
Input parameters:
pair #1
pair # 2
The 12 o'clock at night should be considered "0", i.e. every day at 12 o'clock at night the "sliding" starts to be recalculated.
I will write a free indicator for MQL4 on the terms of free distribution - placement as a free product on the Market or code in CodeBase.
I can also write it in MQL5, but my preference is for MQL4 - it depends on the logic and, of course, it is better to write something meaningful. Theoretically, an Expert Advisor is also possible.
Naturally, the tasks like - I want an indicator based on Elliot's wave theory - are not considered =) Since assess the amount of work and think about it.
If you want - write the job openly.
In advance, think through the possibilities - alerts, beepers, notifications to the mail / phone, arrows, news, etc.
I don't understand MQL4 stuff, I'm just a dummy over 9000. Help Help me please)))
I don't understand MQL4 stuff, I'm just a dummy over 9000. Help Help me please)))
If you're talking about your own indicators, it won't work, you can only apply an indicator to another one from the standard ones in Metatrader suite, you could use an example to clarify exactly what you need.
Yuri, how difficult is it to implement the approach (see description below and picture) to create an indicator?
We need an indicator that shows the distance between points on the timeframe that is specified on the chart, the value of which will be either a histogram or as a line
in this case (see formula below):
x=time it will be the same for both symbols
y=the price value at the moment when the candle opened or closed (either better)
Input parameters:
pair #1
pair # 2
at the same time 12 o'clock at night counts as "0" i.e. every day at 12 o'clock at night the "sliding" starts to count again
What do you want to get as a result? For example, the lines of two symbols from 0 - 24 hours will be in the form of "sliding"
first did not quite understand the sense of calculating the distance, it will probably be in points per minute / hour (not the point). how will it differ from the fact that simply impose one symbol on another, simply scaling them, for example, what do you want to see?
just different symbol pairs have different rates of movement and volatility
what do you want to get as a result? well, for example you will have a line of two characters from 0 - 24 hours in the form of "sliding"
first did not quite understand the meaning of calculating the distance, it will probably be in pips per minute / hour (not the point). how will it differ from the fact that simply impose one symbol on another, just scaling them up for example, what do you want to see?
just different symbol pairs have different rates of movement and volatility
- you should get something similar to this (see screenshot below)
- yes the distance will be in pips
- the difference is that we will be able to see the maximum daily deviations in the spread as on the screenshot
- of course i understand that every pair has different valatility, i just did not want to complicate the task, it was interesting to see what would happen at this stage
Hello Yuri.
Please help me write an indicator, based on one line that connects extrema, as shown in the picture, so that the shadow is below/above the extremum shadow and the close of the candle is below the high/low of this candle (as shown in the picture)
This is something between Fractals and Zig Zag, but unfortunately I don't own mql4, I would be very grateful to you.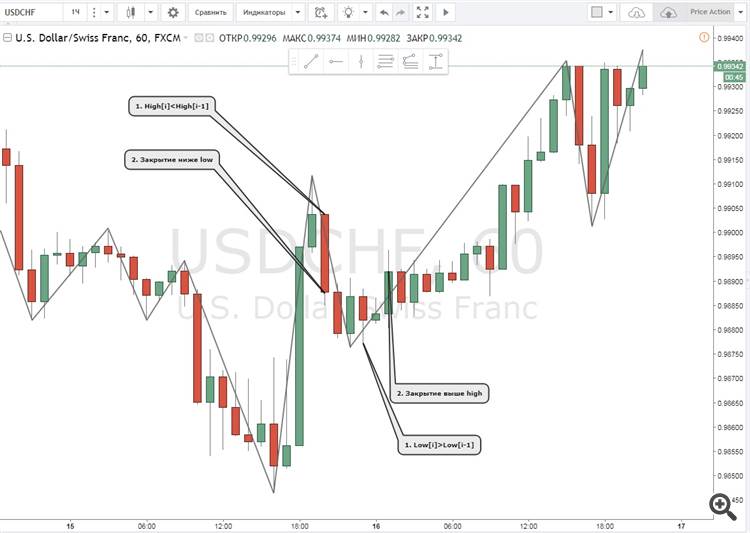
Hello, please help me write an arrow indicator for the candlestick analysis algorithm
here are four in a series of 4 candles in one direction is our algorithm and then if a series of three candles in one direction and immediately a signal against the trend
The idea of the robot algorithm is simple if a series of 3 candles in one direction signal against the trend if such a signal will be four in a row in the wrong direction arrow they need to be flashed and then on the fifth candle formation was the signal