Machine learning in trading: theory, models, practice and algo-trading - page 1489
You are missing trading opportunities:
- Free trading apps
- Over 8,000 signals for copying
- Economic news for exploring financial markets
Registration
Log in
You agree to website policy and terms of use
If you do not have an account, please register
If anyone understands HMM, then please help me to solve the problem, if the issue is solvable, I will share the grail)
https://ru.stackoverflow.com/questions/984699/%D0%A1%D0%BA%D1%80%D1%8B%D1%82%D0%B0%D1%8F-%D0%9C%D0%B0%D1%80%D0%BA%D0%BE%D0%B2%D1%81%D0%BA%D0%B0%D1%8F-%D0%BC%D0%BE%D0%B4%D0%B5%D0%BB%D1%8C-hmm-%D0%BF%D0%BE%D1%87%D0%B5%D0%BC%D1%83-%D0%BE%D1%82%D0%BB%D0%B8%D1%87%D0%B0%D1%8E%D1%82%D1%81%D1%8F-%D0%BF%D1%80%D0%BE%D0%B3%D0%BD%D0%BE%D0%B7%D1%8B-%D1%81%D0%BE%D1%81%D1%82%D0%BE%D1%8F%D0%BD%D0%B8%D0%B9
well, the state is Markovian, but what model? tabular method or what
it means you need more points for squared window, at least
and if a random series is fed, what kind of prediction other than 50\50 can we talk about?It means that you need more points for the squared window, at least
I wrote that I even took several thousand points
And if a random series is fed, then what kind of prediction other than 50/50 can we talk about?
What difference does it make, the data are the same, the model is the same
i predict new data with the whole function in the package (as in all the examples on the net etc...) the results are great
I use the same model to predict the same data but with sliding window and the result is different, unacceptable.
That's actually the question - what's the problem?I told you that I even took several thousand points
What difference does it make, the data are the same, the model is the same
I try to forecast new data using the function in the whole package (as in all the examples on the web, etc...) the results are great
i predict the same data with the same model but in a sliding window and the result is different, unacceptable.
That's actually the question - what's the problem?I don't know what kind of model you're using and where you're getting your states from. without any packages, what's the point?
Maybe the gsci is such that it doesn't give out any random output, that's why it gets predicted in the 1st case. Try to change seed for train and test to see that in the first case you can not predict anything, otherwise I don't know how to help the idea is not clear
Splits are made according to the probability of classification. More precisely, not by probability, but by classification error. Because everything is known on the training drill, and we have not probability, but an exact estimate.
Although there are different splitting fi ries, i.e. measures of impurity (left or right sampling).
I was referring to the distribution of classification accuracy over the sample, not the total as it is done now.
it is not clear what kind of model and where you get the states from. Without any packages, conceptually what is the point
Maybe the gsche is such that it doesn't give out any randomness, so it gets predicted in the 1st case. Try to change seed for train and test to see that in the first case it's impossible to predict anything, otherwise I don't know how to help the idea is not clear
Here is the file, there are prices and two columns with predictors "data1" and "data2
You take and teach HMM only two states(on a data track without a teacher) on these two columns ("data1" and "data2") in Python or whatever you like. You don't touch the price, but you do it for visualization
Then you take the Viterbi algorithm and come to (data test)
we get two states, it should look like this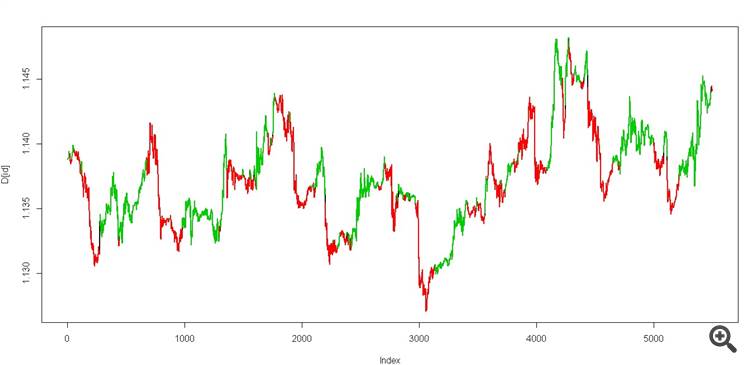
It's a real grail))
And then try to calculate the same Viterbi in a sliding window on the same data
Here is the file, there are prices and two columns with predictors "data1" and "data2"
You take and teach HMM only two states(on the data track) on these two columns ("data1" and "data2") in Python or whatever you like and don't touch the price, only for visualization
Then you take the Viterbi algorithm and (data test)
we get two states, it should look like this
It's a real grail.)
And then try to count the same Viterbi in a sliding window on the same data
Senk, I'll look at it later, I'll write it down, because I myself work with Markovian
Senk, I'll check it out later and report back, since I'm working with Markov's myself
how are you doing?
How's it going?
I haven't looked yet, it's my day off) I'll write back when I have time, I mean later in the week.
I took a look at the packs for now. I think it fitshttps://hmmlearn.readthedocs.io/en/latest/tutorial.html