Discussion of article "Combinatorics and probability theory for trading (Part III): The first mathematical model"
I have been with forex for three years, I am a hobbyist looking for, I treat it as a good mind exercise and a puzzle :) but at the same time I believe that there is a metamodel :) although you have to remember that Forex is not our business, it is someone's business in which this someone has goal to earn money, our money :)
While testing simple EA models, I asked myself what was generating the price / current candlestick chart.
1.In the Order Book we see buy / sell offers (no market orders are visible there)
2.Offers have price and volume (aggregated)
3. The market buyer / seller comes and places the order on the market, and the deal is carried out with the closest price from the offers "order book" and price moves to this place.
If this is true, then in special cases the price may be changed
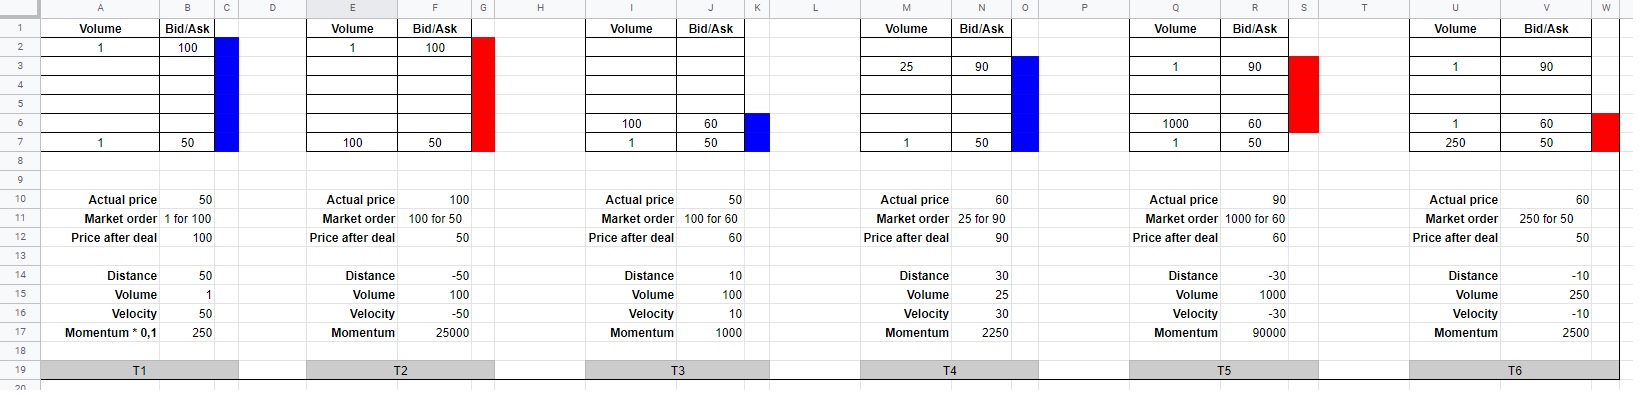
a) by a large distance with a small amount of volume, or
b) by a small distance with a very large amount.
Istarted to wonder because the only thing that drives the price is the incoming on-market orders that fulfil the pending offers.
Offers may wait, be changed, etc., but these changes in the price itself do not change, only an incoming and executed on-market order causes it.
... and we do not see the on-market order itself, we do not know when it will come, with what volume and at whatprice.
Idrew an example of the price movement in excel
Ido not know if I understand it well and I do not know if this quality can be used
.
The author is handsome! Deep!!! I really recognise what the author is doing, and I'll take the liberty of saying I know what result he will eventually arrive at. But as always what follows is a big BUT. The most difficult thing is what to do with the obtained information? Since there is no unambiguous answer at the end of the tunnel. Although .....
Thank you, there are indeed still more questions than answers. Specifically, what can be done with this model? Well for example it is possible to fully model trend strategies of various complexity without having to resort to tester testing, also this model can now fully describe CarryTrade. On its basis it is possible to make equations to find extremes of profitability of this strategy and calculate the most profitable configurations for a particular broker (all this can be done on the fly in the Expert Advisor). But of course not in a bare form, but with some additions. This is just what I can think of ).
I have been with forex for three years, I am a hobbyist looking for, I treat it as a good mind exercise and a puzzle :) but at the same time I believe that there is a metamodel :) although you have to remember that Forex is not our business, it is someone's business in which this someone has goal to earn money, our money :)
While testing simple EA models, I asked myself what was generating the price / current candlestick chart.
1.In the Order Book we see buy / sell offers (no market orders are visible there)
2.Offers have price and volume (aggregated)
3. The market buyer / seller comes and places the order on the market, and the deal is carried out with the closest price from the offers "order book" and price moves to this place.
If this is true, then in special cases the price may be changed
a) by a large distance with a small amount of volume, or
b) by a small distance with a very large amount.
Istarted to wonder because the only thing that drives the price is the incoming on-market orders that fulfil the pending offers.
Offers may wait, be changed, etc., but these changes in the price itself do not change, only an incoming and executed on-market order causes it.
... and we do not see the on-market order itself, we do not know when it will come, with what volume and at whatprice.
Idrew an example of the price movement in excel
Ido not know if I understand it well and I do not know if this quality can be used
.
Thanks for the support ! And with regards to your conclusions, everything is really so, by the way, I myself have recently considered the same thoughts approximately. The only problem is that on MT4 it is unlikely that it will give anything, there is not really a glass there. But on MT5, some brokers show a real order book. So far, I haven't dealt with such advisors for obvious reasons. But in general, I can say that yes, everything is exactly as you described. I am sure that you can use this where you can get the most accurate and reliable glass. By the way, the levels are also based on these considerations. If we connect the theory of probability, then it will be possible to compose differential equations of price movement, based on the data of the order book. I think this is not difficult to do. I could.
By the way, we do not know when the market order will come, in fact, we know there is a probability of coming, we cannot know more. These differential equations will be probabilistic, and their capabilities will only include calculating the odds, since the price is a probabilistic model, it never has a clear future. In such cases, probabilities are used and instead of a clear future we get a clear probability, that's the trick.
Dzięki za wsparcie! A jeśli chodzi o twoje wnioski, wszystko jest naprawdę tak, nawiasem mówiąc, sam ostatnio rozważałem w przybliżeniu te same myśli. że problem jest problem, że na MT jest mało, cokolwiek, tak naprawdę nie ma tego problemu. Ale na MT5 maklerzy śledcze wyznaczniki. Do tej pory nie trzeba tłumaczyć, więc nie ma możliwości czynienia z takimi doradcami. Ale ogólnie mogę powiedzieć, że tak, wszystko jest w nawierzchni takie, jak opisałeś. Jestem pewien, że możesz to tam, gdzie możesz uzyskać dokładne i jasne. Nawiasem mówiąc, poziomy są również oparte na tych rozważaniach. Jeśli połączymy teorię prawdopodobieństwa, to na podstawie danych z księgi zleceń będzie skomponować. Myślę, że nie jest na trudnej sytuacji. Mógłbym.
Swoją tak nie ma drogi, kiedydzie warstwy rynku, w rzeczywistości w rzeczywistości, że jest prawdopodobieństwo, że nie możemy wiedzieć więcej. Teoretyczne stypendystyczne będą tylko probabilistyczne, a ich możliwości będą miały status równy prawnie, ponieważ cena jestle modelem probabilistycznym, nigdy nie ma jasnych danych przyszłoś W takich przypadkach używających się prawdopodobieństw i bezpieczniej, aby zapewnić sobie bezpieczeństwo, to jest sztuczka.
Myślimy o dokładnie podobnej rzeczy. Kiedy zrozumiałem, co i dlaczego cena się zmienia, zrozumiałem też, że na danym poziomie cenowym jest kupujący/sprzedawca, który jej "broni".
Wiadomo, że mali handlarze niczego nie obronią, ale można szukać dużych śladów.
Opracowałem szybkie EA (proste), które oblicza fizyczną wartość momentu pędu dla każdej świecy (ponieważ jestem fizykiem) i teraz jest kilka ciekawych rzeczy:
1. Zasada zachowania pędu, czyli suma pędów jest stała w czasie. Należy pamiętać, że pęd jest wektorem.
2. Potrafię dostrzec świece, które mają bardzo wysoki moment pędu i zaznaczyć ich poziom oraz wg. dla mnie te poziomy są przynajmniej poziomami cieczy dostawcy lub dobrymi liniami S/D. Testując do UE, podzieliłem rozmiar pędu na trzy: bardzo duży, duży i średni. Możesz wyraźnie zobaczyć, które świece generują poziomy i jak cena zareaguje na nie w przyszłości. Według mnie możesz spróbować tutaj stworzyć strategię.
3. Zauważyłem, że ważne poziomy są wyznaczane przez świece, o których wizualnie nigdy bym nie podejrzewał, że generują ważny poziom.
4. Dodatkowo mogę sprawdzić dynamikę danej waluty w kilku odstępach czasu i zobaczyć, co się dzieje. Np. dla H1 patrz i handluj liniami S / D z D1.
5.i co najważniejsze, dziś się domyśliłem, teraz pracuję nad łapaniem świec o wysokim momencie obrotowym na kilku walutach, np. EU, UJ, GU itp. aby sprawdzić, czy są w jakiś sposób zsynchronizowane lub czy pieniądze w jakiś sposób płyną.
W komentarzach ciężko mówić :)
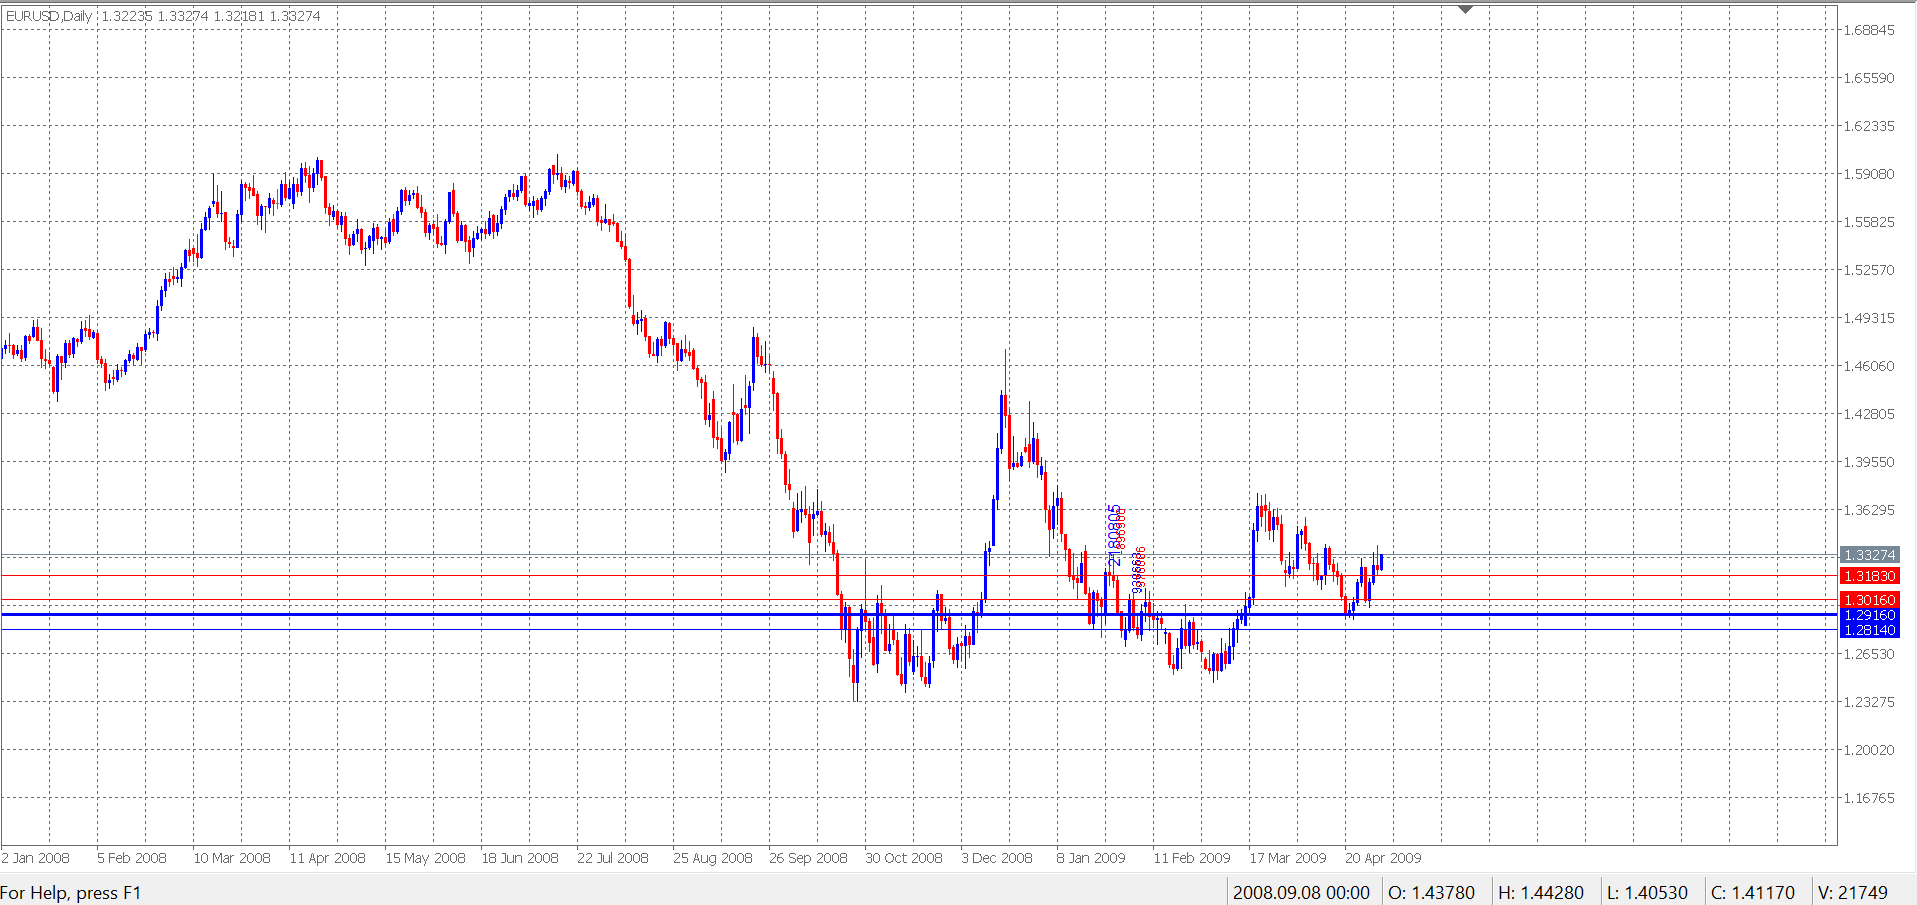
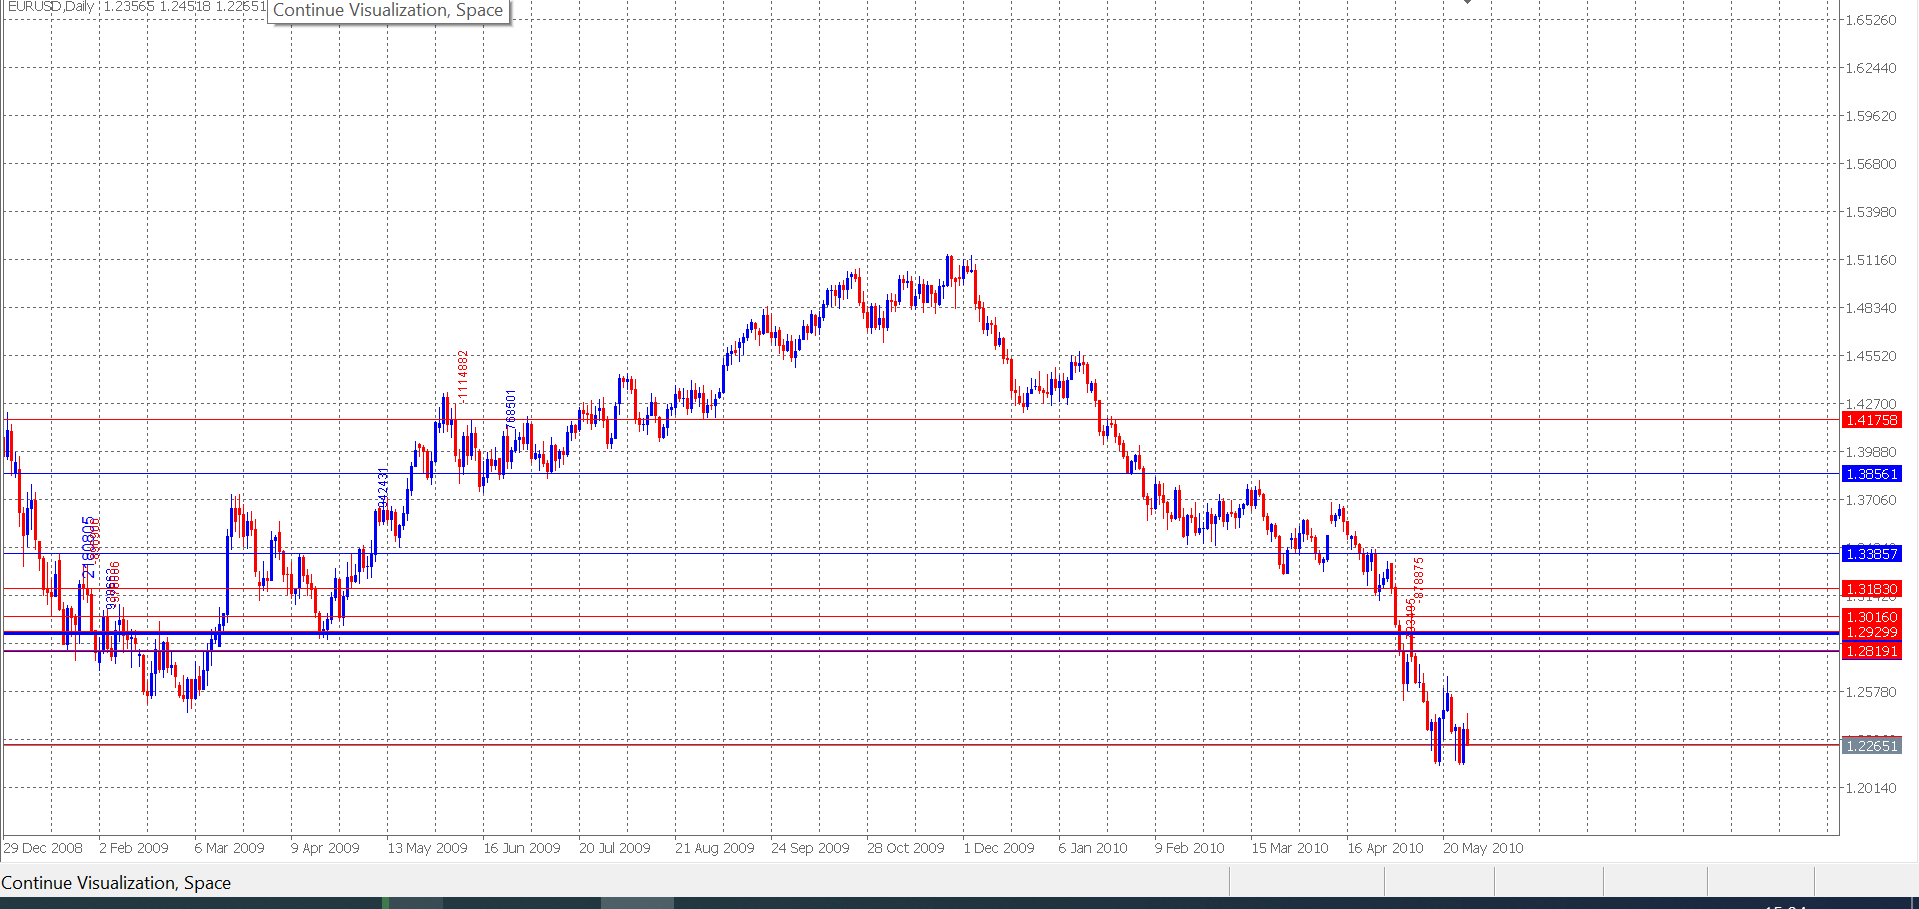
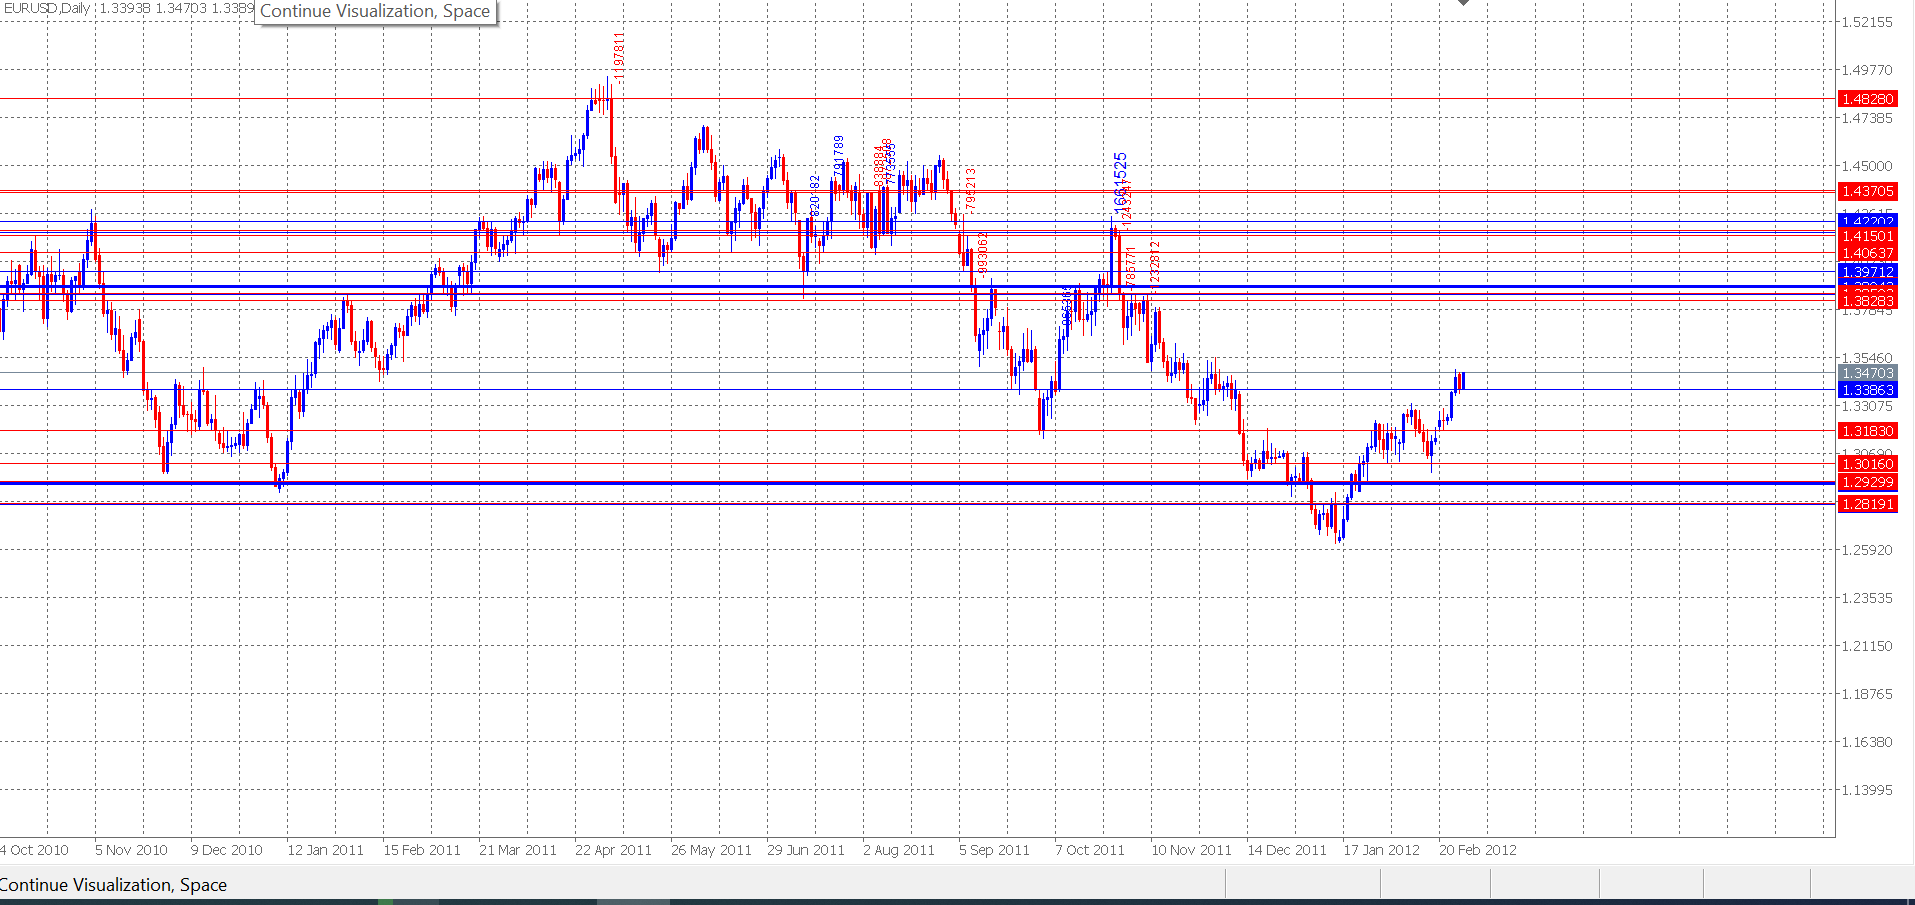
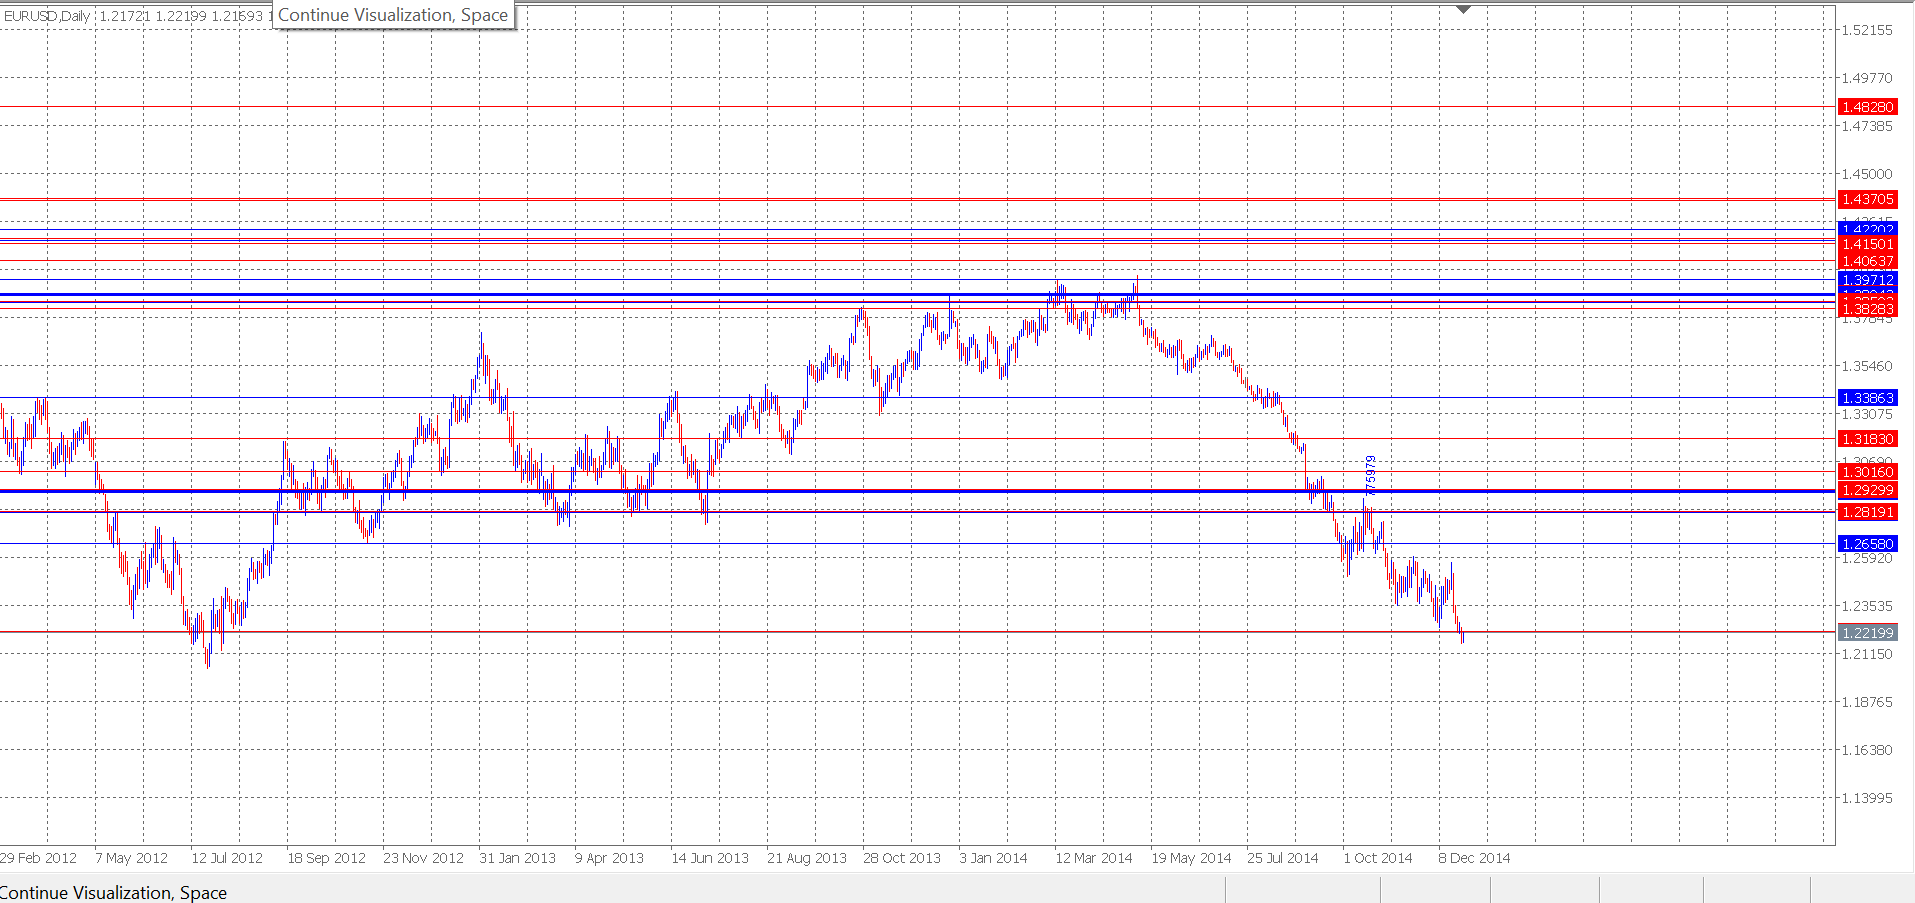
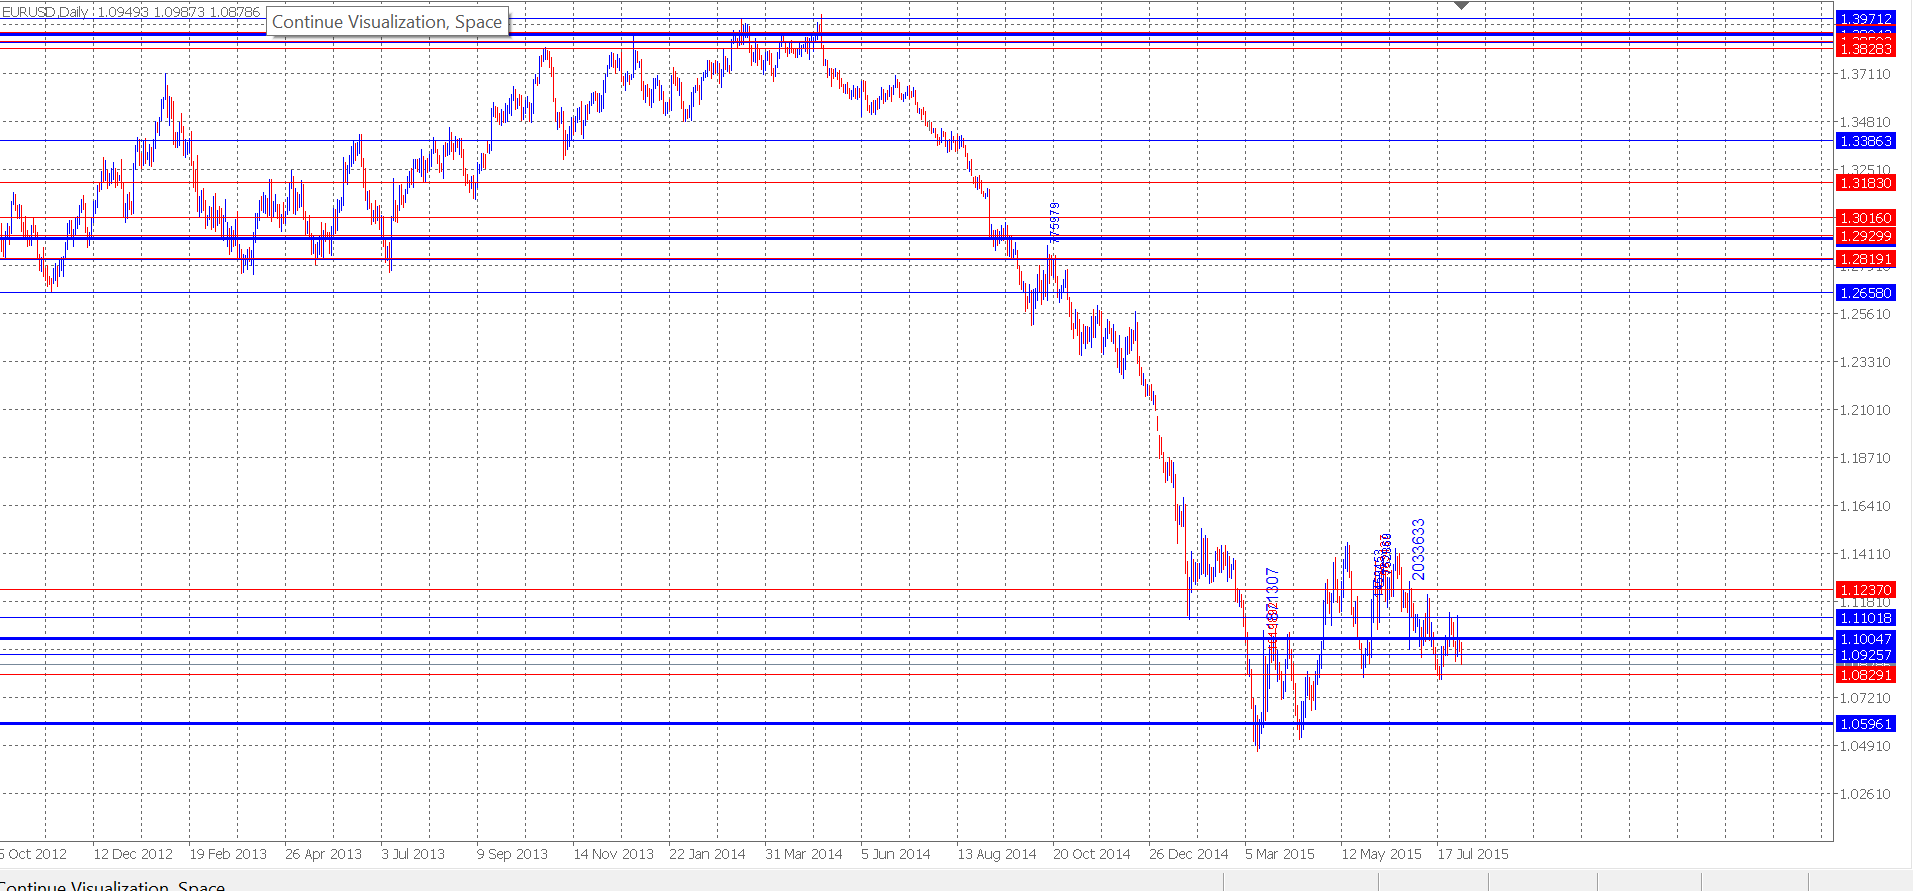
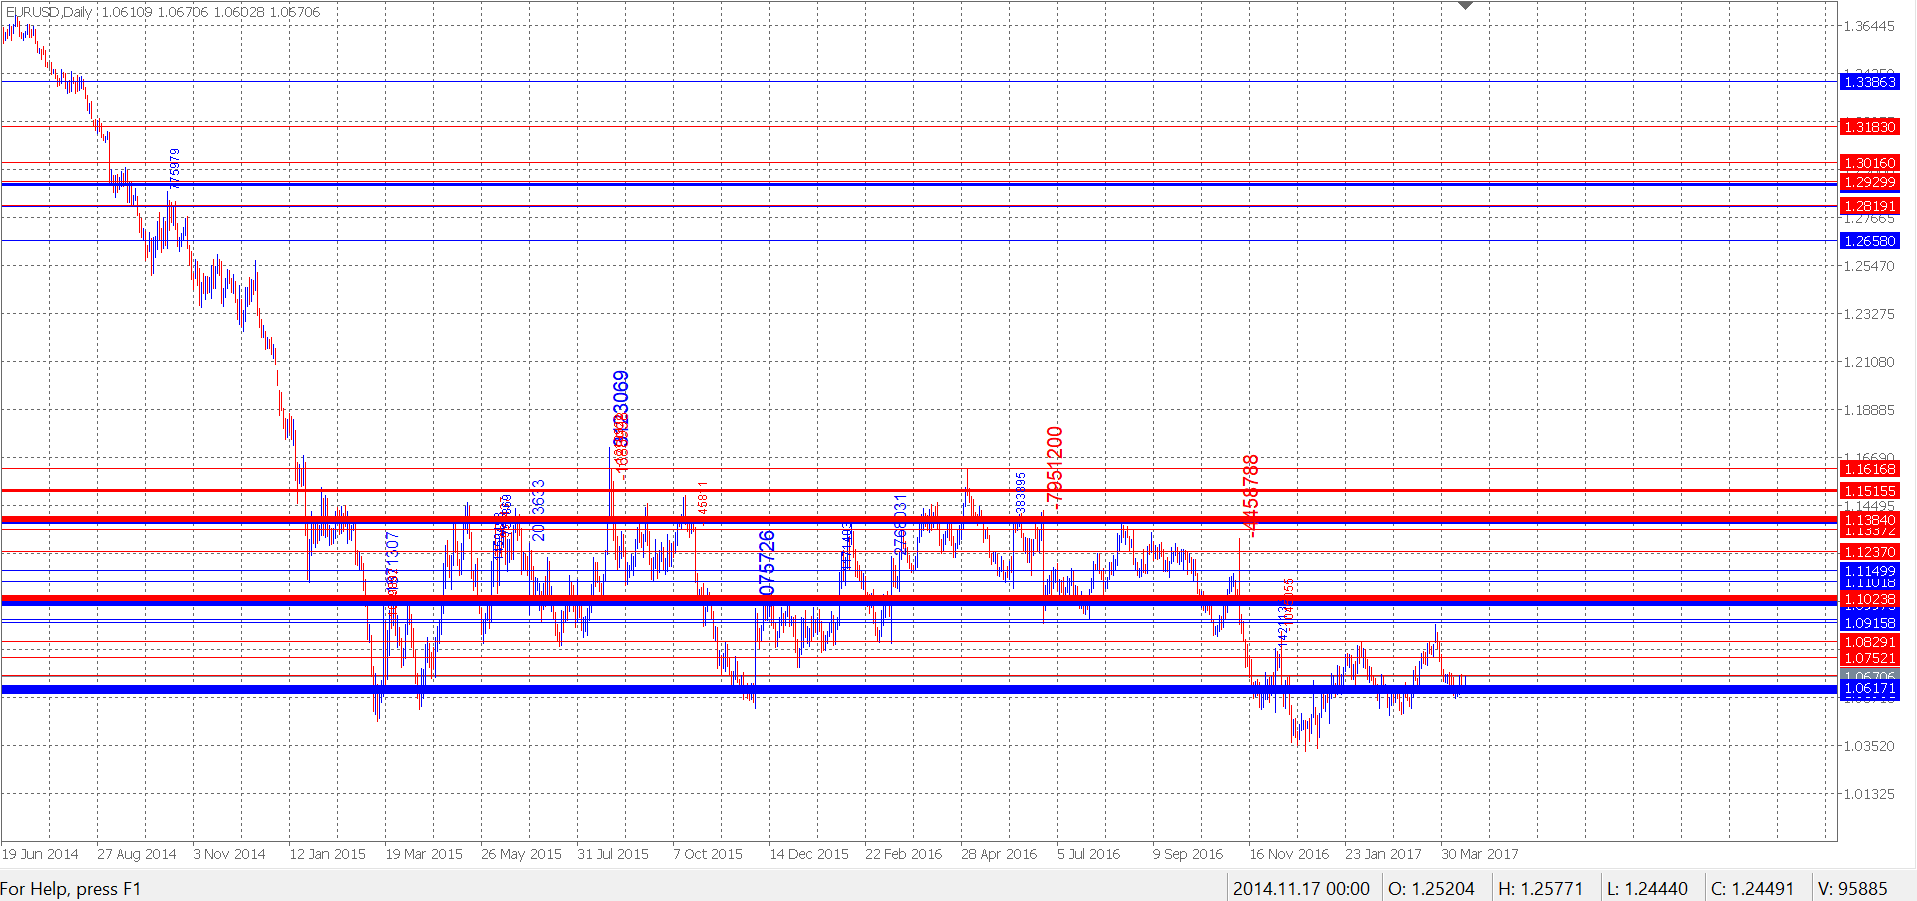
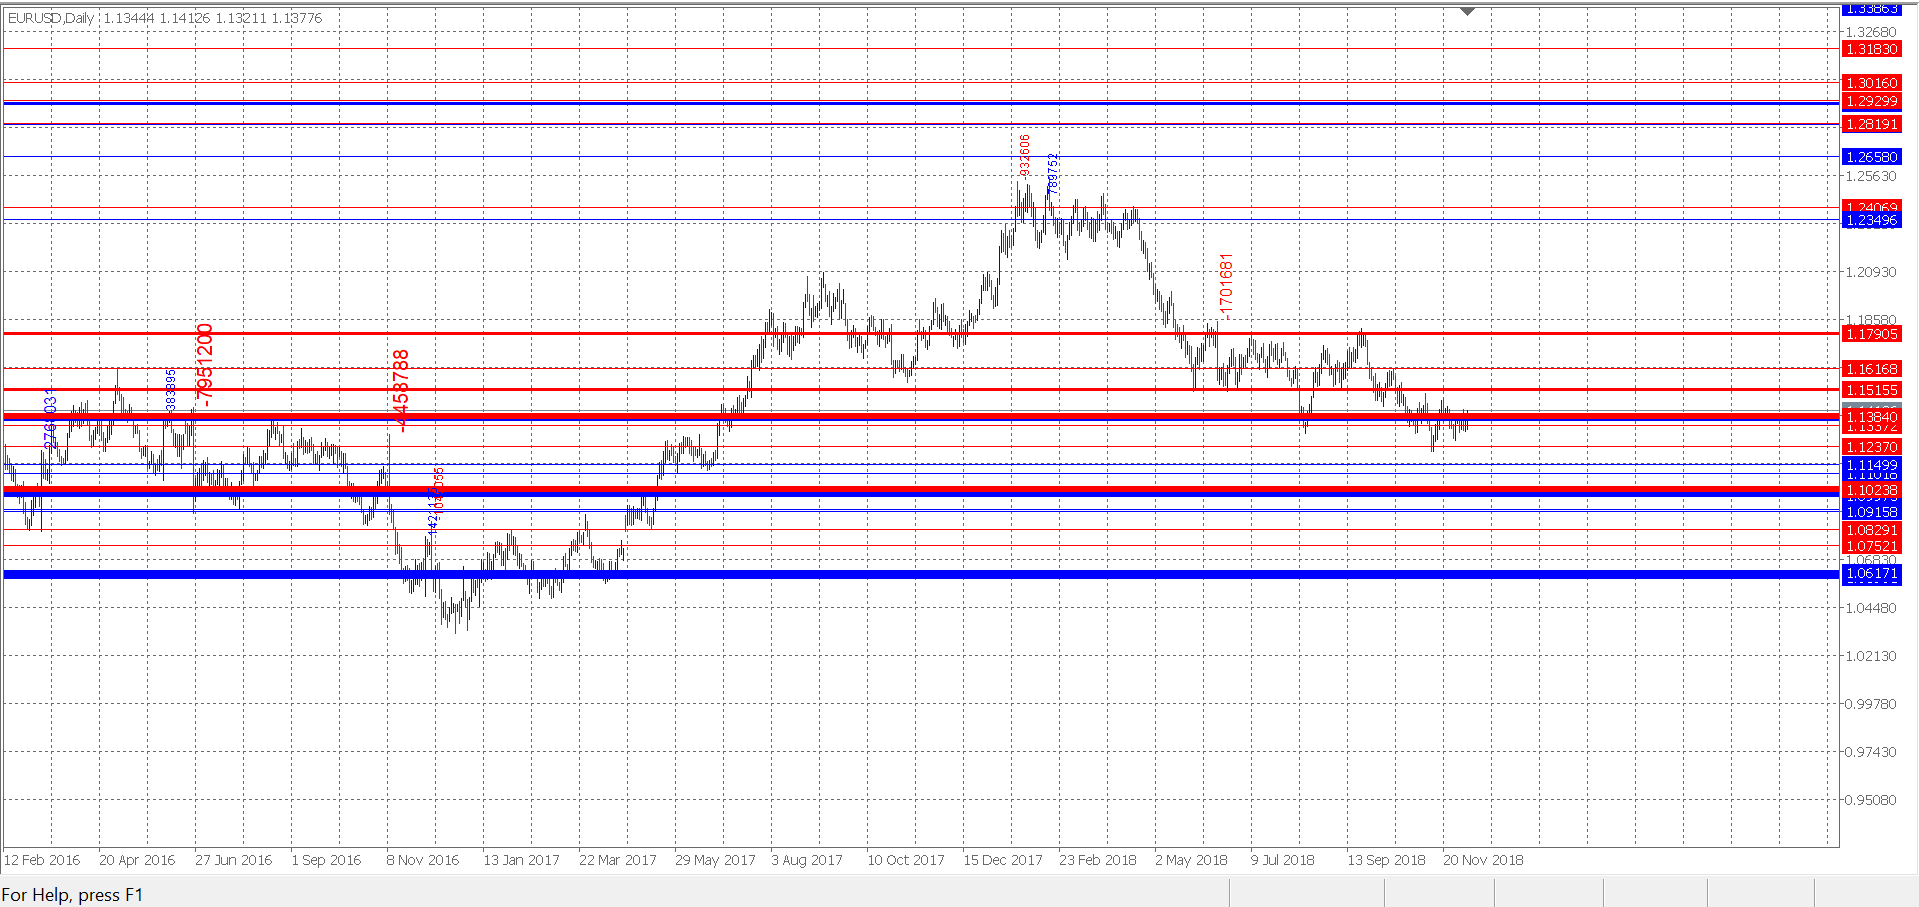
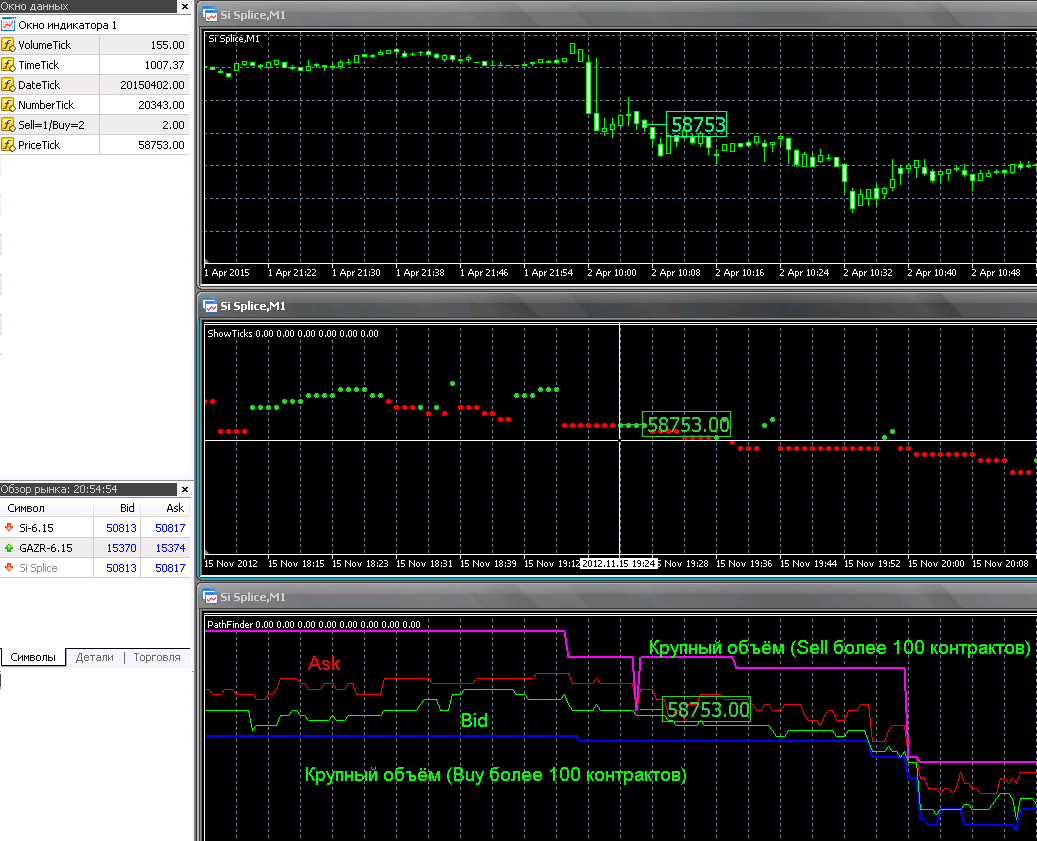
Załączam kilka zrzutów ekranu z generowania poziomów, poziomy pojawiają się na świecach, które mają etykietę z wartością momentu. Możesz zobaczyć poziom na żywo, kiedy nadchodzi wielki momentu i jak cena zachowuje się w stosunku do niego później. Na przykład w latach 2015-2017 można zobaczyć piękną walkę niedźwiedzi z bykami.
I have been with forex for three years, I am a hobbyist looking for, I treat it as a good mind exercise and a puzzle :) but at the same time I believe that there is a metamodel :) although you have to remember that Forex is not our business, it is someone's business in which this someone has goal to earn money, our money :)
While testing simple EA models, I asked myself what was generating the price / current candlestick chart.
1.In the Order Book we see buy / sell offers (no market orders are visible there)
2.Offers have price and volume (aggregated)
3. The market buyer / seller comes and places the order on the market, and the deal is carried out with the closest price from the offers "order book" and price moves to this place.
If this is true, then in special cases the price may be changed
a) by a large distance with a small amount of volume, or
b) by a small distance with a very large amount.
Istarted to wonder because the only thing that drives the price is the incoming on-market orders that fulfil the pending offers.
Offers may wait, be changed, etc., but these changes in the price itself do not change, only an incoming and executed on-market order causes it.
... and we do not see the on-market order itself, we do not know when it will come, with what volume and at whatprice.
Idrew an example of the price movement in excel
Ido not know if I understand it well and I do not know if this quality can be used
.
An illustration of what you have written, please take a look.
New article Combinatorics and probability theory for trading (Part III): The first mathematical model has been published:
Author: Evgeniy Ilin
- Free trading apps
- Over 8,000 signals for copying
- Economic news for exploring financial markets
You agree to website policy and terms of use
New article Combinatorics and probability theory for trading (Part III): The first mathematical model has been published:
A logical continuation of the earlier discussed topic would be the development of multifunctional mathematical models for trading tasks. In this article, I will describe the entire process related to the development of the first mathematical model describing fractals, from scratch. This model should become an important building block and be multifunctional and universal. It will build up our theoretical basis for further development of this idea.
The fractal nesting principle can be schematically shows like this:
The figure shows four states that symbolize different fractals which can be expressed by each other. The transition from one state to another is possible through any chain. An arbitrarily chosen chain is shown on the right. A little below it is shown that this chain can be of any length and complexity, and you can iterate through the same state an unlimited number of times. It means that the formula for the average number of steps in a fractal can be presented as a chain of products, which represent fractal nesting levels.
Author: Evgeniy Ilin