Load CiMA for each timeframes on the same current window
I actually update the code with some plots and buffers. I know all this may be unnecessary, who know? :(
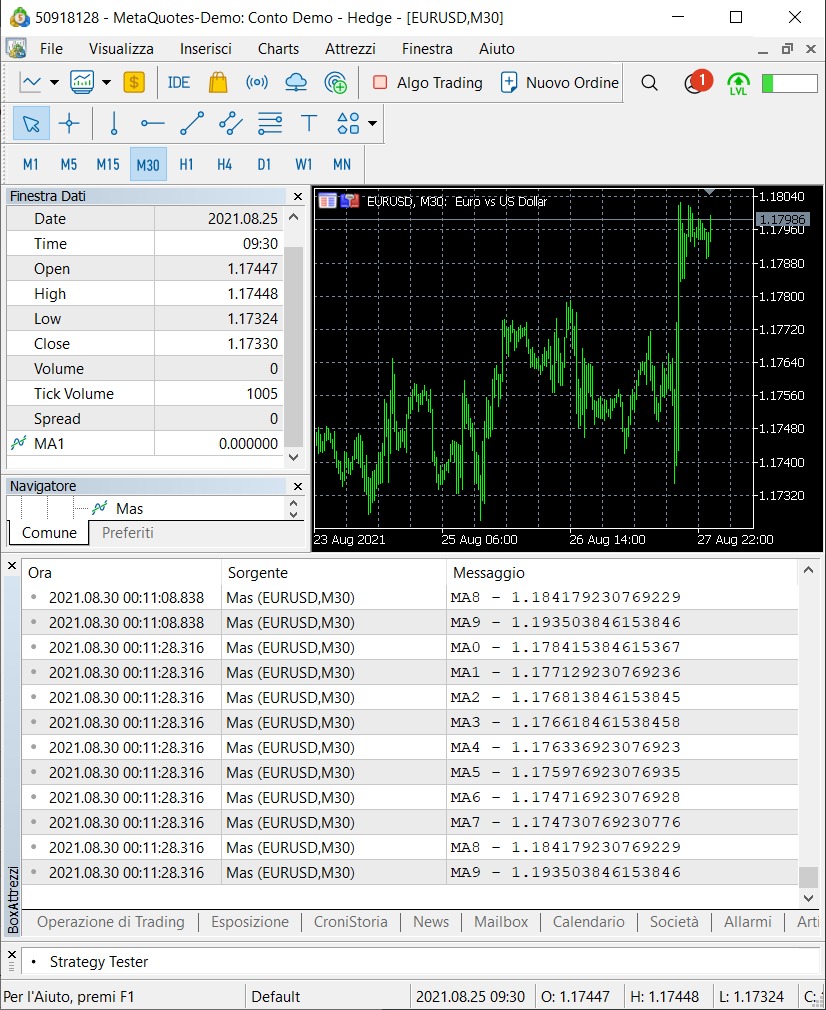
It's strange because the use of historical data draw wrong MAs (maybe missing data) and when I load the indicator on a current chart (even today) I get 6 MAs on W1 timeframe (??) and none on other TFs,very strange because:
if(TFs[i] <= Period())
         continue;
should exclude all MA below W1.
BTW, still cant get it draw correct CiMA
#property indicator_chart_window
#property indicator_buffers 21
#property indicator_plots   21

//--- plot MA
#property indicator_label1  "MA1"
#property indicator_type1   DRAW_LINE
#property indicator_color1  clrRed
#property indicator_style1  STYLE_SOLID
#property indicator_width1  1
//--- plot MA
#property indicator_label2  "MA2"
#property indicator_type2   DRAW_LINE
#property indicator_color2  clrRed
#property indicator_style2  STYLE_SOLID
#property indicator_width2  1
//--- plot MA
#property indicator_label3  "MA3"
#property indicator_type3   DRAW_LINE
#property indicator_color3  clrRed
#property indicator_style3  STYLE_SOLID
#property indicator_width3  1
//--- plot MA
#property indicator_label4  "MA4"
#property indicator_type4   DRAW_LINE
#property indicator_color4  clrRed
#property indicator_style4  STYLE_SOLID
#property indicator_width4  1
//--- plot MA
#property indicator_label5  "MA5"
#property indicator_type5   DRAW_LINE
#property indicator_color5  clrRed
#property indicator_style5  STYLE_SOLID
#property indicator_width5  1
//--- plot MA
#property indicator_label6  "MA6"
#property indicator_type6   DRAW_LINE
#property indicator_color6  clrRed
#property indicator_style6  STYLE_SOLID
#property indicator_width6  1
//--- plot MA
#property indicator_label7  "MA7"
#property indicator_type7   DRAW_LINE
#property indicator_color7  clrRed
#property indicator_style7  STYLE_SOLID
#property indicator_width7  1
//--- plot MA
#property indicator_label8  "MA8"
#property indicator_type8   DRAW_LINE
#property indicator_color8  clrRed
#property indicator_style8  STYLE_SOLID
#property indicator_width8  1
//--- plot MA
#property indicator_label9  "MA9"
#property indicator_type9   DRAW_LINE
#property indicator_color9  clrRed
#property indicator_style9  STYLE_SOLID
#property indicator_width9  1
//--- plot MA
#property indicator_label10  "MA10"
#property indicator_type10   DRAW_LINE
#property indicator_color10  clrRed
#property indicator_style10  STYLE_SOLID
#property indicator_width10  1
//--- plot MA
#property indicator_label11  "MA11"
#property indicator_type11   DRAW_LINE
#property indicator_color11  clrRed
#property indicator_style11  STYLE_SOLID
#property indicator_width11  1
//--- plot MA
#property indicator_label12  "MA12"
#property indicator_type12   DRAW_LINE
#property indicator_color12  clrRed
#property indicator_style12  STYLE_SOLID
#property indicator_width12  1
//--- plot MA
#property indicator_label13  "MA13"
#property indicator_type13   DRAW_LINE
#property indicator_color13  clrRed
#property indicator_style13  STYLE_SOLID
#property indicator_width13  1
//--- plot MA
#property indicator_label14  "MA14"
#property indicator_type14   DRAW_LINE
#property indicator_color14  clrRed
#property indicator_style14  STYLE_SOLID
#property indicator_width14  1
//--- plot MA
#property indicator_label15  "MA15"
#property indicator_type15   DRAW_LINE
#property indicator_color15  clrRed
#property indicator_style15  STYLE_SOLID
#property indicator_width15  1
//--- plot MA
#property indicator_label16  "MA16"
#property indicator_type16   DRAW_LINE
#property indicator_color16  clrRed
#property indicator_style16  STYLE_SOLID
#property indicator_width16  1
//--- plot MA
#property indicator_label17  "MA17"
#property indicator_type17   DRAW_LINE
#property indicator_color17  clrRed
#property indicator_style17  STYLE_SOLID
#property indicator_width17  1
//--- plot MA
#property indicator_label18  "MA18"
#property indicator_type18   DRAW_LINE
#property indicator_color18  clrRed
#property indicator_style18  STYLE_SOLID
#property indicator_width18  1
//--- plot MA
#property indicator_label19  "MA19"
#property indicator_type19   DRAW_LINE
#property indicator_color19  clrRed
#property indicator_style19  STYLE_SOLID
#property indicator_width19  1
//--- plot MA
#property indicator_label20  "MA20"
#property indicator_type20   DRAW_LINE
#property indicator_color20  clrRed
#property indicator_style20  STYLE_SOLID
#property indicator_width20  1
//--- plot MA
#property indicator_label21  "MA21"
#property indicator_type21   DRAW_LINE
#property indicator_color21  clrRed
#property indicator_style21  STYLE_SOLID
#property indicator_width21  1

//--- input parameters
input int InpMaPeriod=13;
input int InpMaShift=0;
input ENUM_MA_METHOD InpMaMethod=MODE_SMA;
input ENUM_APPLIED_PRICE InpAppliedPrice=PRICE_CLOSE;

#include <Arrays\ArrayObj.mqh>
#include <Indicators\Trend.mqh>

CiMA *ma;
CArrayObj Mas;

//--- indicator buffers
double   ExtBuff1[];
double   ExtBuff2[];
double   ExtBuff3[];
double   ExtBuff4[];
double   ExtBuff5[];
double   ExtBuff6[];
double   ExtBuff7[];
double   ExtBuff8[];
double   ExtBuff9[];
double   ExtBuff10[];
double   ExtBuff11[];
double   ExtBuff12[];
double   ExtBuff13[];
double   ExtBuff14[];
double   ExtBuff15[];
double   ExtBuff16[];
double   ExtBuff17[];
double   ExtBuff18[];
double   ExtBuff19[];
double   ExtBuff20[];
double   ExtBuff21[];

static ENUM_TIMEFRAMES TFs[] =
  {
   PERIOD_M1,PERIOD_M2,PERIOD_M3,PERIOD_M4,PERIOD_M5,
   PERIOD_M6,PERIOD_M10,PERIOD_M12,PERIOD_M15,PERIOD_M20,
   PERIOD_M30,PERIOD_H1,PERIOD_H2,PERIOD_H3,PERIOD_H4,
   PERIOD_H6,PERIOD_H8,PERIOD_H12,PERIOD_D1,PERIOD_W1,
   PERIOD_MN1
  };

//+------------------------------------------------------------------+
//| Custom indicator initialization function                         |
//+------------------------------------------------------------------+
int OnInit()
  {
//--- indicator buffers mapping
   SetIndexBuffer(0,ExtBuff1,INDICATOR_DATA);
   SetIndexBuffer(0,ExtBuff2,INDICATOR_DATA);
   SetIndexBuffer(0,ExtBuff3,INDICATOR_DATA);
   SetIndexBuffer(0,ExtBuff4,INDICATOR_DATA);
   SetIndexBuffer(0,ExtBuff5,INDICATOR_DATA);
   SetIndexBuffer(0,ExtBuff6,INDICATOR_DATA);
   SetIndexBuffer(0,ExtBuff7,INDICATOR_DATA);
   SetIndexBuffer(0,ExtBuff8,INDICATOR_DATA);
   SetIndexBuffer(0,ExtBuff9,INDICATOR_DATA);
   SetIndexBuffer(0,ExtBuff10,INDICATOR_DATA);
   SetIndexBuffer(0,ExtBuff11,INDICATOR_DATA);
   SetIndexBuffer(0,ExtBuff12,INDICATOR_DATA);
   SetIndexBuffer(0,ExtBuff13,INDICATOR_DATA);
   SetIndexBuffer(0,ExtBuff14,INDICATOR_DATA);
   SetIndexBuffer(0,ExtBuff15,INDICATOR_DATA);
   SetIndexBuffer(0,ExtBuff16,INDICATOR_DATA);
   SetIndexBuffer(0,ExtBuff17,INDICATOR_DATA);
   SetIndexBuffer(0,ExtBuff18,INDICATOR_DATA);
   SetIndexBuffer(0,ExtBuff19,INDICATOR_DATA);
   SetIndexBuffer(0,ExtBuff20,INDICATOR_DATA);
   SetIndexBuffer(0,ExtBuff21,INDICATOR_DATA);

   generateMas();

//---
   return(INIT_SUCCEEDED);
  }

//+------------------------------------------------------------------+
//| Custom indicator iteration function                              |
//+------------------------------------------------------------------+
int OnCalculate(const int rates_total,
                const int prev_calculated,
                const datetime &time[],
                const double &open[],
                const double &high[],
                const double &low[],
                const double &close[],
                const long &tick_volume[],
                const long &volume[],
                const int &spread[])
  {
//---
   if(prev_calculated==rates_total)
     {
      for(int i=0; i<Mas.Total(); i++)
        {
         CiMA *m_ma = Mas.At(i);
         m_ma.Refresh();
         Print("MA", i, " - ", m_ma.Main(0));
        }
     }

//--- return value of prev_calculated for next call
   return(rates_total);
  }

//+------------------------------------------------------------------+
//| Timer function                                                   |
//+------------------------------------------------------------------+
void OnTimer()
  {
//---

  }

//+------------------------------------------------------------------+
//| ChartEvent function                                              |
//+------------------------------------------------------------------+
void OnChartEvent(const int id,
                  const long &lparam,
                  const double &dparam,
                  const string &sparam)
  {
//---

  }

//+------------------------------------------------------------------+
//|                                                                  |
//+------------------------------------------------------------------+
void OnDeinit(const int reason)
  {
   Mas.Clear();
  }

//+------------------------------------------------------------------+
//|                                                                  |
//+------------------------------------------------------------------+
void generateMas()
  {
   for(int i=0; i<ArraySize(TFs); i++)
     {
      if(TFs[i] <= Period())
         continue;

      ma = new CiMA();
      ma.Create(_Symbol,TFs[i],InpMaPeriod,InpMaShift,InpMaMethod,InpAppliedPrice);
      ma.AddToChart(ChartID(), 0);

      Mas.Add(ma);
      Print("Ma created: ", i);
     }
  }
//+------------------------------------------------------------------+
You are missing trading opportunities:
- Free trading apps
- Over 8,000 signals for copying
- Economic news for exploring financial markets
Registration
Log in
You agree to website policy and terms of use
If you do not have an account, please register
Hi,
I'm trying to display a MA(13) foreach timeframe on the same window and current timeframe.
The code is very simple and I expect to view 21 MA on the screen but this doesnt seems to work, am I missing something?