Discussion of article "Indicator for Constructing a Three Line Break Chart"
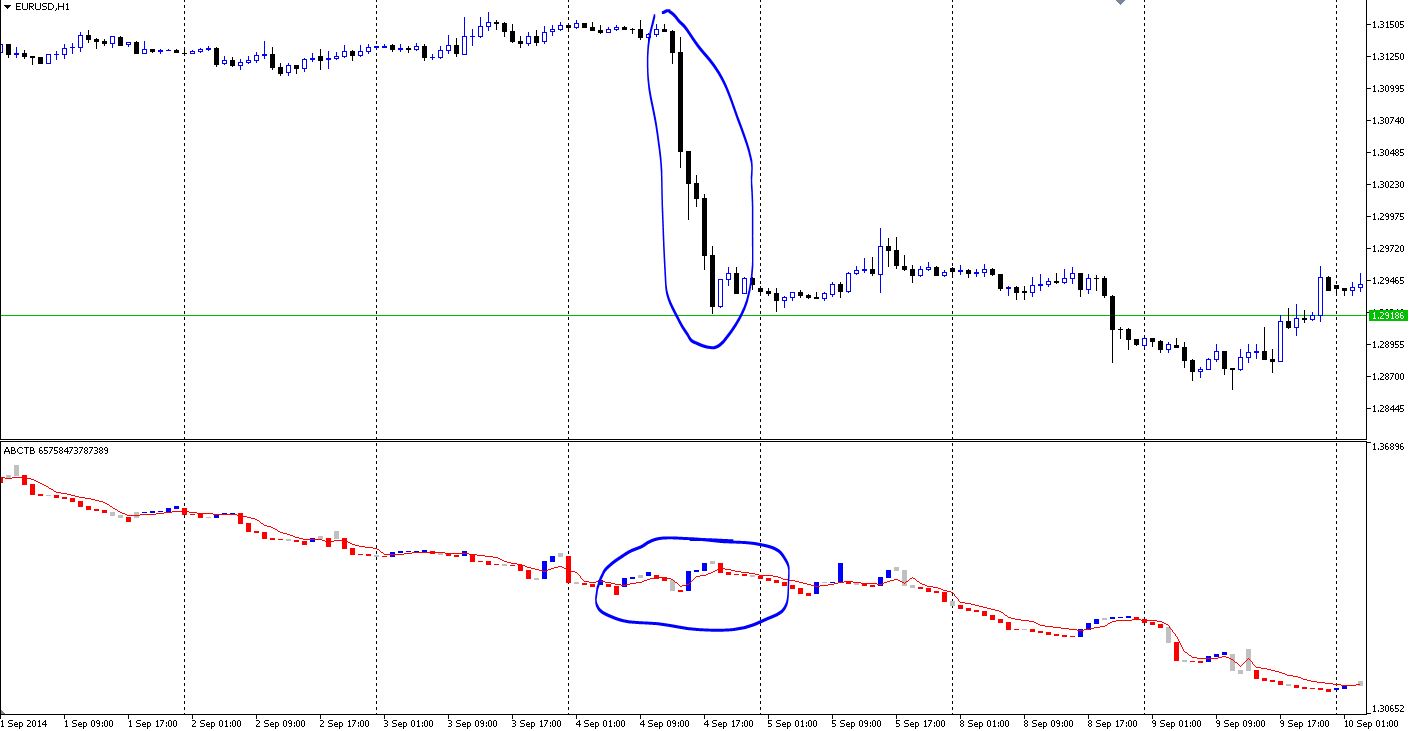
I don't understand this indicator. I have attached a screen
MetaQuotes:
Can this be used for MT4 platform?
New article Indicator for Constructing a Three Line Break Chart has been published:
Author: Dmitriy Zabudskiy
cat7:
The indicator ignores the time scale. For a more accurate diagnosis of what is happening, it is necessary to analyse the settings used. I can assume that the marked upper fragment stands on the lower chart in the rightmost sector, not in the middle as marked. The chart fragment that is marked on the lower part has a price level around 1.330, and on the upper marked part the peak is around 1.315.
I don't understand this indicator. I have attached a screen
dhrubahaz:
Can this be used for MT4 platform?
Can this be used for MT4 platform?
Long ago, not write on MT4. I think need modification for use on MT4.
Very good.
This is very excellent program and article.
Thanks very much.
jcs14567:
Thanks for the comment.
This is very excellent program and article.
Thanks very much.
Thanks for the author for the great article.
While I was exploring the MQL5 Markets I found a Three Line Break for MT4 and it is Free.
Here is the link:
https://www.mql5.com/en/market/product/3123
Regards

Technical Indicator Line Break Chart MT4
- 2014.02.21
- Daniel Lewis
- www.mql5.com
This indicator displays a Line Break chart in the main chart window. To view the line break chart on its own, change the main chart window to display a Line Chart and then change the "Line chart" color to "None" in the F8 properties dialog. When...
Hi, thank you for your article. Is it possible please for you to convert it in C# language? Many thanks in advance.
karlson3:
Hi, thank you for your article. Is it possible please for you to convert it in C# language? Many thanks in advance.
Hi! I'm writing only on MQL5. Programming is my hobby, and I have very little time to do them.
Hi, thank you for your article. Is it possible please for you to convert it in C# language? Many thanks in advance.
You are missing trading opportunities:
- Free trading apps
- Over 8,000 signals for copying
- Economic news for exploring financial markets
Registration
Log in
You agree to website policy and terms of use
If you do not have an account, please register
New article Indicator for Constructing a Three Line Break Chart has been published:
Previous articles considered Point and Figure, Kagi and Renko charts. Continuing the series of articles about charts of the 20th century, this time we are going to speak about the Three Line Break chart or, to be precise, about its implementation through a program code. There is very little information about the origin of this chart. I suppose it started in Japan. In the USA they learned about it from "Beyond Candlesticks" by Steve Nison published in 1994.
As well as in the charts mentioned above, the time range is not taken into account when constructing the Three Line Break chart. It is based on newly formed closing prices of a certain timeframe, which allows filtering minor fluctuations of a price in relation to the previous movement.
Steve Nison in his book "Beyond Candlesticks" described eleven principles of plotting this chart (p. 185). I have consolidated them into three.
Let us take a closer look at the example of a classic chart construction based on historical data (fig. 1).
Fig.1 Example of constructing a Three Line Break chart (EURUSD H1 27.06.2014)
Author: Dmitriy Zabudskiy