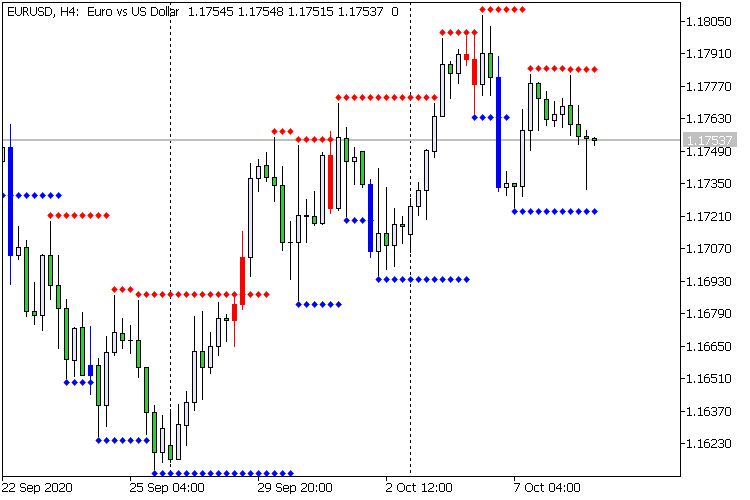
Example of indicator: Fractals Corridor Breakdown
When a fractal appears, extend it until a new one is found so that you can see more clearly where the price will break through the fractal. The candlestick that breaks through the fractal is colored:

Figure: 1. Fractals Corridor Breakdown
Thus, the indicator visualizes a line from the fractal and a candlestick that breaks through the fractal.

Fractals Corridor Breakdown
- www.mql5.com
Индикатор на основе iFractals. Плюс зарисовка свечи, которая пробивает фрактал
You are missing trading opportunities:
- Free trading apps
- Over 8,000 signals for copying
- Economic news for exploring financial markets
Registration
Log in
You agree to website policy and terms of use
If you do not have an account, please register
Hi! I am making a few adjustments in the Fractals indicator from MetaQuotes and i am trying to create more dots to the right, like a support and resistance line, i need 5 more dots to the right instead of just one but i am having a hard time doing it
Can someone show me the way? I needed something like this but with a fixed amount of 5 dots if possible, i have some idea of what is controlling the dots but i am not being able to find how to add more.
This is the Fractals code:
https://www.mql5.com/pt/code/30
Thanks in advance.