Pivot point
Hello everyone,
I have one question for you guys.
I have a pivot point indicator but I don't understand :
If I have a my pivot set to hourly and my chart set to 1 minute. Every period should be 60 right ?
If I have a my pivot set to monthly and my chart set to 1 day. Every period should be 30 minus the days off and the changing months right ?
In my chart the pivot point calculate the périod every 65 periods in monthly. Is that normal ?
Thank you for your answer.
Ps : I am using mt4.
If you are able to set the Pivot timeframe then it should display pivot for that timeframe regardless of what period chart you are using
If you are able to set the Pivot timeframe then it should display pivot for that timeframe regardless of what period chart you are using
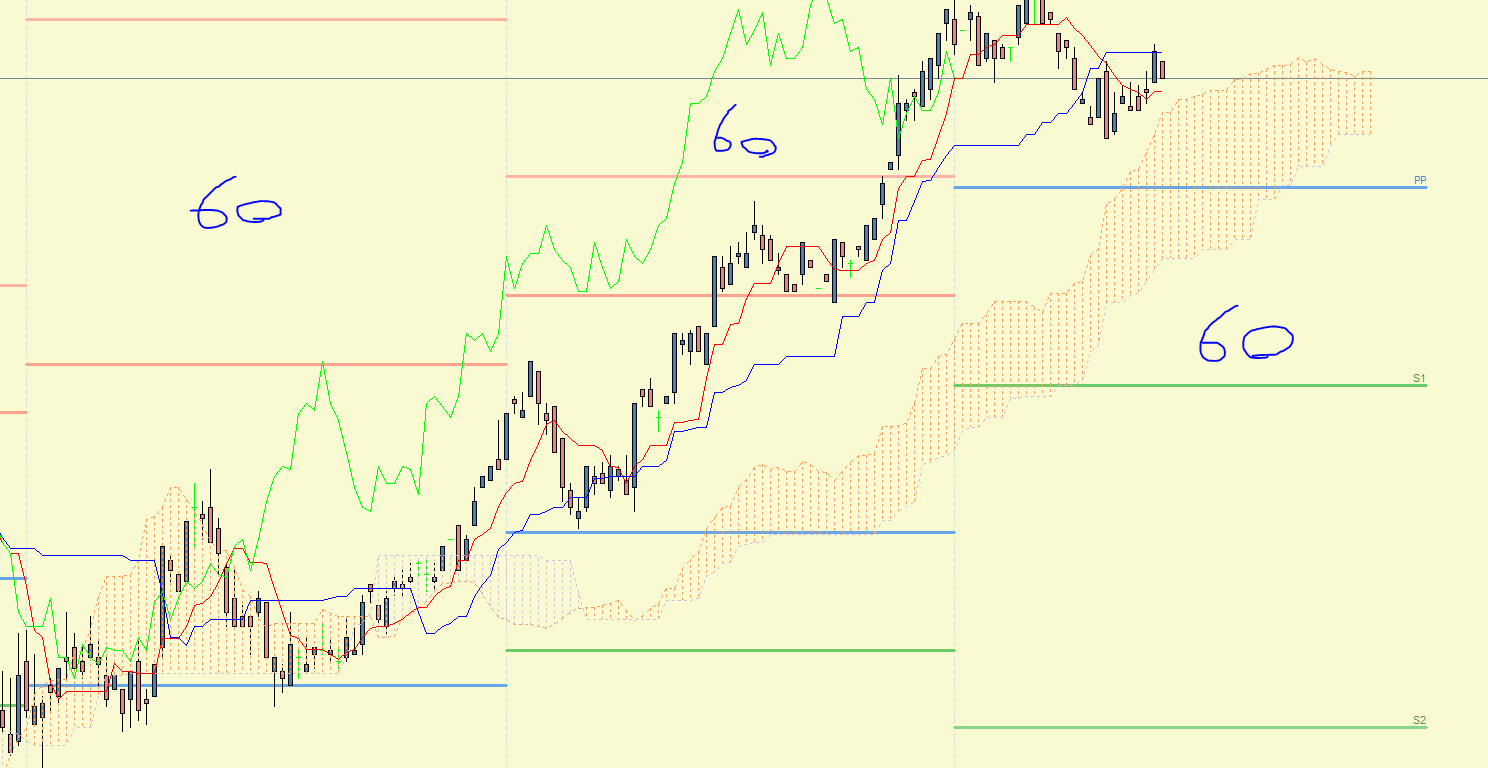
When I set the AUD/CHF chart to M1 and the pivot point to H1 I get this : (see the image M1 - H1)
The pivot point evenly spaces itself with 60 candlestick per period.
When I set the same chart to D1 and the pivot point to MN I get this : (see the image D1 - MN)
The pivot point gives 22 candlesticks excpect for the last period. It gives 53 candlesticks. Why ???
Also why the lines keep forever on the right side ? And not stopping at the end of the period like the M1 chart ?
The lack of punctuality info from the pivot point is really becoming a problem.
With nothing to go on other than a picture nobody can say why, clearly it is not coded very well or there are data issues.
With nothing to go on other than a picture nobody can say why, clearly it is not coded very well or there are data issues.
If you type "pivot point mt4" on google it should be the first link. The one with "fxssi".
You can try for yourself.
Are you a developer ? If so can you help out with this ?
Anyone to help me out with this ?
like I said bad code or bad data, unless you supply the source code nobody is going to be able to help you..
- Free trading apps
- Over 8,000 signals for copying
- Economic news for exploring financial markets
You agree to website policy and terms of use
Hello everyone,
I have one question for you guys.
I have a pivot point indicator but I don't understand :
If I have a my pivot set to hourly and my chart set to 1 minute. Every period should be 60 right ?
If I have a my pivot set to monthly and my chart set to 1 day. Every period should be 30 minus the days off and the changing months right ?
In my chart the pivot point calculate the périod every 65 periods in monthly. Is that normal ?
Thank you for your answer.
Ps : I am using mt4.