Find out arrow indicator Position at chart for EA
I have updated
Hey .
How much is the arrow indicator lagging ? This is not the solution ,but you will have to consider it if you intend to use this live .
Then i assume you want to find the points where this occurs on the chart ,and if we are talking about a lagging arrow then you want the most
recent occurence of the screenshot starting from the current bar ?
without having checked because i dont have the indicators :
/*
    imagine a senario where the arrow on bar 3 appears when bar 0 opens
    the code cant see it because its probably not there yet .laggy arrow most probably .it
    does not mean the indicator is bad , it may mean that there is no other way to calculate that.
    So you will have to shift from staring at bar 1 to looking for the latest occurence of that event ,and then based
    on the data ,evaluate ,and decide if you want to trade .
void checkforsignal(){
    double uparrow = iCustom(NULL,0,"BrainTrend2SigALERT5",0,1);
    double downarrow = iCustom(NULL,0,"BrainTrend2SigALERT5",1,1);
    double dotarrow = iCustom(NULL,0,"FL03",0,1);
    double fl1 = iCustom(NULL,PERIOD_CURRENT,"FL1",0,1);
    //double joker = iCustom(NULL,0,"FL2",0,1);
    Print("Up arrow value= ", uparrow);
    Print("Down arrow value= ", downarrow);
    Print("Dot arrow value= ", dotarrow);
    Print("Fl1 value= ", fl1);
    if(dotarrow != 0 && dotarrow < fl1){
       if(!OrdersTotal()){
          if(!OrderSend(Symbol(), OP_BUY, Lots, Ask, 3, Bid-SL*Point, Bid+TP*Point, "buyy", 11223, 0, clrAliceBlue))
          PrintFormat("OrderSend error %d",GetLastError());
       }
    }

  }
*/
//step one , the data we need , we can build it so lets do that
/*
you need price of arrow ,price of band ,time of event ,and bar offset (if your decisions are snap)
and also , a way to know if anything was found.
*/
struct fl_event
{
bool found;
datetime event_time;
double arrow_price,band_price;
int bar_ix;
//default reset upon creation - or constructor
fl_event(void){found=false;event_time=0;arrow_price=0;band_price=0;bar_ix=-1;}
};
//we have the data type we need ,now we build a function that returns that data after
//looking for what we instruct it to find
fl_event FindFlCross(int limit,
                     int i_from){
//we wont care about series because mt4
//we declare the result ,it will be of the new type we just built
fl_event result;//no further actions as upon this moment the constructor will be called and reset the result anyway

//now on to the search
/*you may have noticed indicator codes have rates total ,and previously calculated to avoid double passes of the same bar.We wont perform such ninja things here even though its easy ,its off topic*/
//check 1 valid bars
  if(limit<=Bars-1&&i_from>=0)
  {
  //loop
    for(int i=i_from;i<=limit;i++)
    {
    //call our values , it would be optimal if we buffer them every new candle ,but again we are not adressing such issues here
    double uparrow = iCustom(NULL,0,"BrainTrend2SigALERT5",0,i);
    double downarrow = iCustom(NULL,0,"BrainTrend2SigALERT5",1,i);
    double dotarrow = iCustom(NULL,0,"FL03",0,i);
    double fl1 = iCustom(NULL,PERIOD_CURRENT,"FL1",0,i);
    //check conditions ,i imagine theres more for sells ,but thats what you will code ;)
       if(dotarrow!=0&&dotarrow<fl1)
       {
       result.found=true;
       result.event_time=Time[i];
       result.bar_ix=i;
       result.band_price=fl1;
       result.arrow_price=dotarrow;
       break;//could also be return
       }
    }
  //loop ends here
  }
//check 1 valid bars ends here
//return the result
return(result);
}

void OnTick()
{
//then to call this check
//declare a receiver variable ,same type
fl_event result=FindFlCross(your_limit,i_start);
//process results within this block
if(result.found){
//if any result ,do stuff .
//you will have to be careful here too not to use a signal more than once , not to do redundant checks etc
//cheers

}

}
Hey .
How much is the arrow indicator lagging ? This is not the solution ,but you will have to consider it if you intend to use this live .
Then i assume you want to find the points where this occurs on the chart ,and if we are talking about a lagging arrow then you want the most
recent occurence of the screenshot starting from the current bar ?
without having checked because i dont have the indicators :
Hi Lorentzos Roussos
Many thanks for you prompted response and for the code. Yes right your thinking was better assumption, as you not have the indicators. By the way as you said we need to data for a latest time duration like last 40 bars for a chart so we can Identify the value for arrow and band for this duration. I have checked the code with strategy tester. But I am not sure for the call at onTick() funciton at this line of code
fl_event result=FindFlCross(your_limit,i_start);
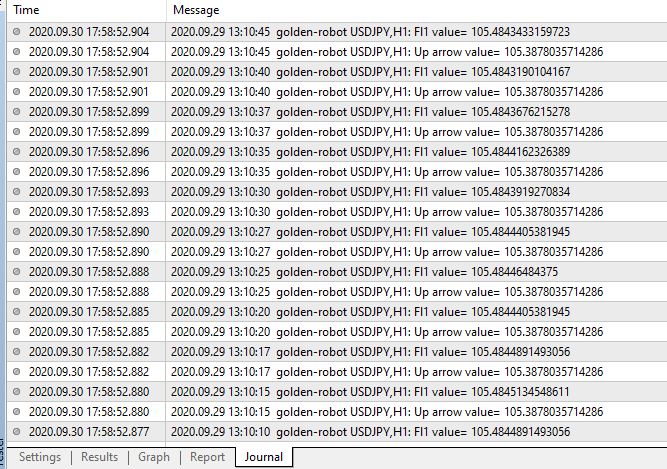
can you please let me know what is limit and i_start, how can i use for this two int for call the struct. Anyway I have test it with two int 40,0 and getting arrow value more times but same (obviously ti will be same) and getting value for band_price. I have attached a screen shot for the values. please let me know how can i check at onTick with them
Thank you again
Hi Lorentzos Roussos
Many thanks for you prompted response and for the code. Yes right your thinking was better assumption, as you not have the indicators. By the way as you said we need to data for a latest time duration like last 40 bars for a chart so we can Identify the value for arrow and band for this duration. I have checked the code with strategy tester. But I am not sure for the call at onTick() funciton at this line of code
can you please let me know what is limit and i_start, how can i use for this two int for call the struct. Anyway I have test it with two int 40,0 and getting arrow value more times but same (obviously ti will be same) and getting value for band_price. I have attached a screen shot for the values. please let me know how can i check at onTick with them
Thank you again
You are welcome.
Correct 40 and 0 ,your_limit is the amount of bars you want to check (40),and i_start is the first bar you check.
you have more data in the structure if you type "result." .
You are welcome.
Correct 40 and 0 ,your_limit is the amount of bars you want to check (40),and i_start is the first bar you check.
you have more data in the structure if you type "result." .
Hi Lorentzos,
So the from 0 to 40 bars is for last/recent bars? I have printed the values at onTick() here is the code
void OnTick()
  {
//---

//then to call this check
//declare a receiver variable ,same type
fl_event result=FindFlCross(40,0);
//process results within this block
if(result.found){
//if any result ,do stuff .
//you will have to be careful here too not to use a signal more than once , not to do redundant checks etc
//cheers
   if(result.arrow_price < result.band_price){
      Print("Up arrow value= ", result.arrow_price);
      Print("Fl1 value= ", result.band_price);
   }
  }
 }
so I checked again if band_price > arrow_price then this will printe value for up arrow and fl1 value
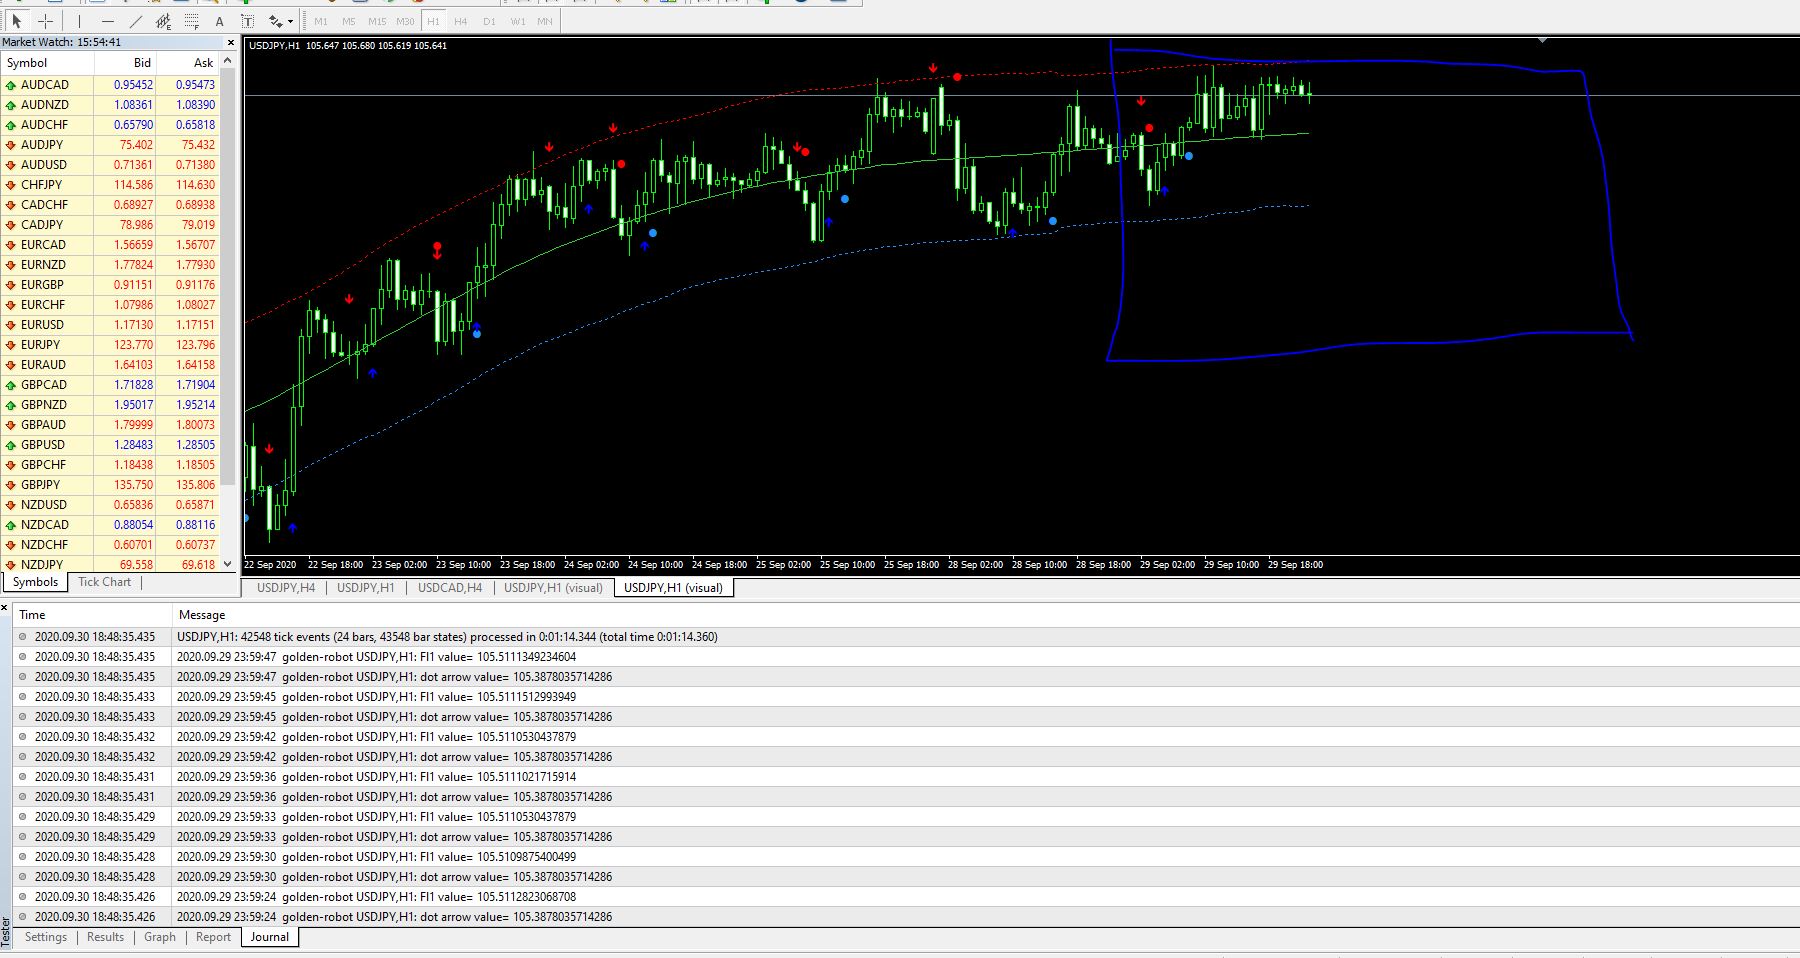
I have tested it at strategy test from 29 to 30 September, I have attached a screen shot you can see I makred the zone there have one dot arrow, this dot arrow value is larger than fl1 value that's why this blue dot showing at top of blue band, but in the journal you will see the fl1 values are always greater
please help
Yes ,the finder looks for when dot is smaller than fl1
and you are printing only when arrow(dot) smaller than fl1
so the fl1 values printed are always greater than the dot values.
Probably mixed up buffers in your analysis ,check them again.
I am clearly showed what is problem i am getting in the video please check the video
please check here I am testing this again
looking for this dot value withing the date range 2 - 3 sept
the value is for fl03 which is dot arrow at our EA is 77.6854
now i am starting the testing at strategy tester
please look i am getting dot arrow value 77.9913 but I showed you it was 77.6854 i am confused for this where the value comming
both three line(top yellow middle green and bottom yellow) are fl1 indicator for fl1 value
I am not getting bottom yellow value
getting top yellow line
please see here
this printed buffer lines for the fl1 indicator
I am not getting blue line values but getting top yellow line
how can getting bottom line for buy entry check?
please help
thanks
https://www.loom.com/share/b26a530e16d0466eb1f63d4738508184

- www.loom.com
Hello,
I have several indicators working together, I wanted to make an EA with this indicators. so my strategy working with 4 indicators results
first of all I got indicators value with iCustom. For arrow indicator I got value from icustom but i wanted to get position for indicator at chart
Because, my startegy is if arrow indicator touch curve band of another indicator i enter trade. please check the screen shot I have attached
you will see a blue up arrow at blue band and here is my code
please let me know how can i get position for the dotarrow and uparrow so i can justify this have either blue band or not
Indicators "FL" came from "Forex Line" series indicators (start from 01 to 23 in numbers) - they are renamed from different indicators,mostly repaint,becare about - for example FL01 and or FL1 is "centered tma bands" indicator
Indicators "FL" came from "Forex Line" series indicators (start from 01 to 23 in numbers) - they are renamed from different indicators,mostly repaint,becare about - for example FL01 and or FL1 is "centered tma bands" indicator
Hi mntiwana,
What do you meant by start from 01 to 23 numbers?
- Free trading apps
- Over 8,000 signals for copying
- Economic news for exploring financial markets
You agree to website policy and terms of use
Hello,
I have several indicators working together, I wanted to make an EA with this indicators. so my strategy working with 4 indicators results
first of all I got indicators value with iCustom. For arrow indicator I got value from icustom but i wanted to get position for indicator at chart
Because, my startegy is if arrow indicator touch curve band of another indicator i enter trade. please check the screen shot I have attached
you will see a blue up arrow at blue band and here is my code
please let me know how can i get position for the dotarrow and uparrow so i can justify this have either blue band or not