Is there an indicator which displays the total amount of bullish/bearish pips from a given period?
I'm looking for an indicator, I'm not sure if it already exists, so I'm coming here to ask first.
Basically it's just the total amount of pips from green candles and the total amount of pips from red candles within the given period.
An example would be, a week of bullish movement on EURUSD, you apply the indicator to the daily timeframe and you want the values of the last week(7 days).
So from the last 7 candles, the total of candles that went up is 350 pips, the total of red candles that went down is 50 pips.
This then gets displayed on the screen.
Or something along these lines. Does something like this already exist? If so, please can someone point me in the right direction.
Many thanks!
Try this
#property copyright "Thread In Mql5.com" #property link "https://www.mql5.com/en/forum/349696" #property description "Telegram : https://t.me/lorentzor\nInstagram : @rlorentzo\nTwitter : @lorentzo_r\nLinkedIn : https://www.linkedin.com/in/lorentzor\nYoutube : https://www.youtube.com/channel/UCM0Lj06cAJagFWvSpb9N5zA\nFacebook : @LorentzoR" /* ways to connect .> : Telegram : https://t.me/lorentzor Instagram : https://www.instagram.com/rlorentzo /OR/ @rlorentzo Twitter : https://twitter.com/lorentzo_r /OR/ @lorentzo_r LinkedIn : https://www.linkedin.com/in/lorentzor Youtube : https://www.youtube.com/channel/UCM0Lj06cAJagFWvSpb9N5zA Facebook : https://www.facebook.com/LorentzoR /OR/ @LorentzoR Mql5.com : https://www.mql5.com/en/users/lorio */ #property version "1.00" #property strict #property indicator_separate_window #property indicator_buffers 4 #property indicator_plots 2 //--- plot BearPips #property indicator_label1 "BearPips" #property indicator_type1 DRAW_LINE #property indicator_color1 clrTomato #property indicator_style1 STYLE_SOLID #property indicator_width1 1 //--- plot BullPips #property indicator_label2 "BullPips" #property indicator_type2 DRAW_LINE #property indicator_color2 clrLimeGreen #property indicator_style2 STYLE_SOLID #property indicator_width2 1 input double divider=1;//divider input bool byAtr=false;//byAtr input int AtrPeriod=14;//AtrPeriod //--- indicator buffers double BearPipsBuffer[]; double BullPipsBuffer[]; double WeekOfYear[]; double AtrAccumulation[]; //+------------------------------------------------------------------+ //| Custom indicator initialization function | //+------------------------------------------------------------------+ int OnInit() { //--- indicator buffers mapping SetIndexBuffer(0,BearPipsBuffer); SetIndexBuffer(1,BullPipsBuffer); SetIndexBuffer(2,WeekOfYear); SetIndexStyle(2,DRAW_NONE,EMPTY,EMPTY,clrNONE); SetIndexBuffer(3,AtrAccumulation); SetIndexStyle(3,DRAW_NONE,EMPTY,EMPTY,clrNONE); //--- return(INIT_SUCCEEDED); } //+------------------------------------------------------------------+ //| Custom indicator iteration function | //+------------------------------------------------------------------+ int OnCalculate(const int rates_total, const int prev_calculated, const datetime &time[], const double &open[], const double &high[], const double &low[], const double &close[], const long &tick_volume[], const long &volume[], const int &spread[]) { //--- int total=rates_total-prev_calculated; int i_from=rates_total-2; if(total<=0){i_from=0;} if(total==1){i_from=1;} //loop double divide_by=Point()*divider; for(int i=i_from;i>=0;i--) { BullPipsBuffer[i]=BullPipsBuffer[i+1]; BearPipsBuffer[i]=BearPipsBuffer[i+1]; if(byAtr){AtrAccumulation[i]=AtrAccumulation[i+1];} WeekOfYear[i]=WeekOfYear(time[i]); if(WeekOfYear[i]!=WeekOfYear[i+1]) { BullPipsBuffer[i]=0; BearPipsBuffer[i]=0; AtrAccumulation[i]=0; } if(!byAtr) { if(close[i]>open[i]&÷_by!=0){BullPipsBuffer[i]+=(close[i]-open[i])/divide_by;} if(close[i]<open[i]&÷_by!=0){BearPipsBuffer[i]+=(open[i]-close[i])/divide_by;} } if(byAtr) { double atr=iATR(_Symbol,_Period,AtrPeriod,i)*divider; AtrAccumulation[i]+=atr; if(close[i]>open[i]&&AtrAccumulation[i]!=0){BullPipsBuffer[i]+=(close[i]-open[i])/AtrAccumulation[i];} if(close[i]<open[i]&&AtrAccumulation[i]!=0){BearPipsBuffer[i]+=(open[i]-close[i])/AtrAccumulation[i];} } } //loop ends here //--- return value of prev_calculated for next call return(rates_total); } int WeekOfYear(datetime time) { int returnio=0; //get year int year=TimeYear(time); string nti="01.01."+IntegerToString(year); datetime newtime=StringToTime(nti);//first day of year //week day of first day of year int dowfdoy=TimeDayOfWeek(newtime); //week day of time int doy=TimeDayOfYear(time); returnio=(int)MathFloor(((double)doy+(double)dowfdoy)/7); return(returnio); }
Try this
Hi!
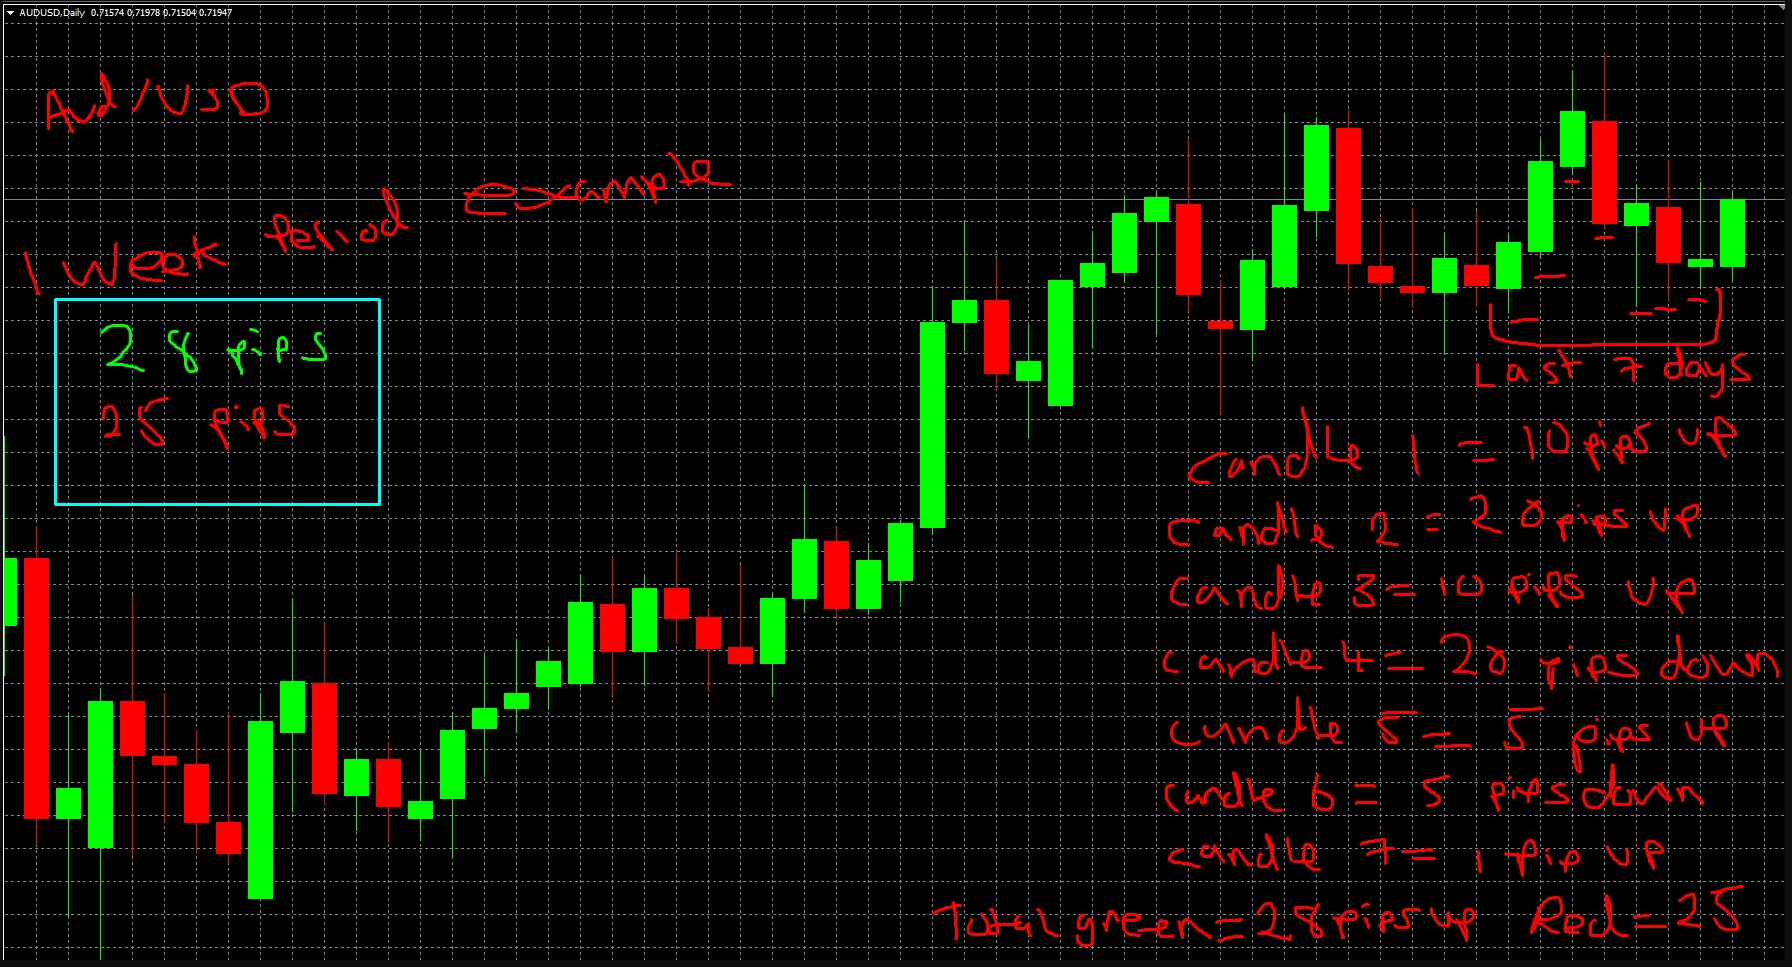
Thanks a lot for writing up the code. However, I think maybe my idea was misunderstood. So I've attached an example in drawing.
Hopefully this is more representative of what I was thinking of :)
Please note the values are not accurate, I just made them up for the purpose of visualisation
Hi!
Thanks a lot for writing up the code. However, I think maybe my idea was misunderstood. So I've attached an example in drawing.
Hopefully this is more representative of what I was thinking of :)
Please note the values are not accurate, I just made them up for the purpose of visualisation
Try this and subscribe to social networks and mql5;)
I will move your topic to the MQL4 and Metatrader 4 section.
- Free trading apps
- Over 8,000 signals for copying
- Economic news for exploring financial markets
You agree to website policy and terms of use
I'm looking for an indicator, I'm not sure if it already exists, so I'm coming here to ask first.
Basically it's just the total amount of pips from green candles and the total amount of pips from red candles within the given period.
An example would be, a week of bullish movement on EURUSD, you apply the indicator to the daily timeframe and you want the values of the last week(7 days).
So from the last 7 candles, the total of candles that went up is 350 pips, the total of red candles that went down is 50 pips.
This then gets displayed on the screen.
Or something along these lines. Does something like this already exist? If so, please can someone point me in the right direction.
Many thanks!