Discussion of article "Random Walk and the Trend Indicator"
В статье есть одно серьёзное противоречие. С одной стороны, мы установили с помощью индикатора трендовости, что реальной курс – трендовый. С другой стороны, мы утверждаем, что реальный курс колеблется в границах горизонтального фундаментального канала. А горизонтальный канал – очень сильный признак антитрендовости.
There is no contradiction here. The fundamental law of supply-demand predicts these effects. Here is the point: the whole model should be considered dynamically, i.e. the boundaries of the horizontal fundamental channel change with time. In order to understand what I am talking about, it is necessary to first consider a classical static supply-demand model (for the "here and now"):
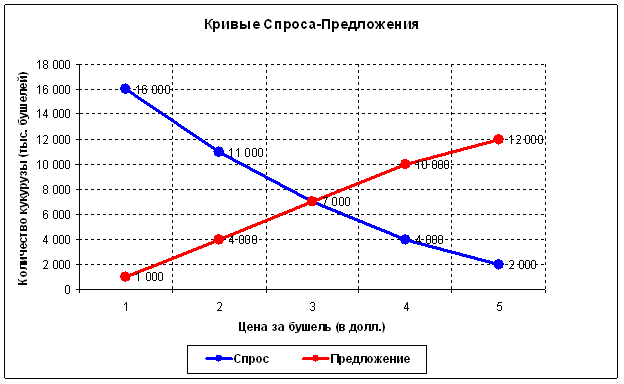
That is, at each point in time, there is only one maximally efficient point of exchange of a good (in this case, 7000 bushels at a $3 price). At all other points, less goods will be exchanged for less money. The macroeconomic situation is constantly changing, which means that this efficient point of exchange itself is also changing. However, the market is efficient, and its main task is to constantly search for such a point or the very equilibrium price ("all who wanted to buy - bought, all who wanted to sell - sold"). The volume at this point should be large, because at this point the maximum amount of goods is exchanged. It takes time for the market to realise such a volume. This theory predicts the effect of volume accumulation:
The market is most of the time in the consolidation phase (in the area of its maximum efficiency).
However, the world economy as a whole is constantly evolving. New technologies emerge, living standards improve. Consequently, on the one hand more and more goods and services are required, and on the other hand scientific and technological progress makes it possible to produce more and more goods and services. Liquidity increases over time. The volume of world markets must grow, and as a consequence their volatility increases, and thus the size of crisis collapses. As demand increases over time, the price rises. At the same time, scientific and technological progress provides this demand with more and more goods and services. Consequently, the equilibrium point will generally shift upwards and to the right over time. The market, constantly wandering around this point, will also generally grow (tends to high prices).

This is where this very "trendiness effect" comes from. It all adds up so well with mathematical calculations that it is simply breathtaking. In any case, economic effects should explain the mathematical dependencies, but not in any case the other way round.
There is one inaccuracy in the article, if we take a drunken sailor as an analogy, then the size of the step is different. Roughly speaking 1 step is 80 cm long if moving from the pub, step back (to the pub) 60 cm. The trend is the same, it is also known that the downward movement of the market is faster than the upward movement. And in the article all steps are the same +1 or -1.
So this model cannot be considered adequate. It is just a coin, whose distribution properties have been known and studied for a long time.
there is one inaccuracy in the article, if we take the drunken sailor as an analogy, then the size of the step is different. Roughly speaking 1 step is 80 cm long if moving from the pub, step back (to the pub) 60 cm. The trend is the same, it is also known that the downward movement of the market is faster than the upward movement. And in the article all steps are the same +1 or -1".
The coin has a continuous analogue - the geometric Brownian motion model. It is described here http://algoritmus.ru/?p=2889.
"Stochastic approach to solving problems of algorithmic trading".
Authors: Arsen Yakovlev, Grigory Franguridi
Published: "D-Shtrich" magazine #16/6 September 2010
This article has the same ideas as my article, just more maths. Whether to take a discrete or continuous model is a matter of taste. They are the same. Only one model has integrals and the other has sums. And the coin model is already understood by schoolchildren, while the continuous model is only understood by students.
" it is also known that the downward movement of the market is faster than the upward movement" - this is very interesting to me - can you give me a link to the research/article - I need it for self-education.
"So this model cannot be considered adequate in any way. It is just a coin whose distribution properties have long been known and studied." - No model adequately describes reality 100 per cent. Including the coin rate as a market model. That's why we had to invent a model of a coin with a trend to be more adequate to the market.
- 2010.09.13
- val
- algoritmus.ru
Why a coin, exactly? It has two sides - what do they reflect? Only an ideal random wandering on a straight line (analogue - up, down), i.e. one-dimensional. The price can have another state - flat, i.e. it is already a coin with three sides, i.e. we have a 2-dimensional random walk. From the above charts we can see that such a market state is practically not modelled - we can't see a hard flat.
The yellow curve in Figure 2 is the closest to a flat. The tightest flat will be obtained if we take the parameter a=-0.5. Then we will get a horizontal line +1 -1 +1 -1 -1 +1 -1 -1 ..... So two sides of the coin are quite enough to describe a flat. By the way, "flat" in terms of the article is called "anti-trend".
But then the whole chart will become more horizontal, if I understand correctly, and in the real market there can be both a sharp trend and a hard flat, i.e. these phenomena are independent. Independence is the need for a third side of the coin. Simply, the market is wandering on the plane, because the time factor wanders, and the coin has a one-dimensional model of wandering, and a simple (without wandering) sweep of this model for time is not quite correct. But despite this article is very useful.
Exactly right, In the coin model with a trend, trendiness is considered to be constant over the entire life of the market. And as the trendiness indicator on the real rate shows, trendiness is constantly changing. And only on average over a long period of time (years) trendiness is measured as a constant.
To make the model "coin rate with trend" correspond to the market, you can complicate it. Parameter "a" can be made chaotically time-dependent or something else can be invented. It's a creative thing. Strictly speaking, there is no need to introduce a second dimension, but if you want to, you can add a second chaotic multiplier next to "a".
A simple model with a constant trend is needed to test, for example, this indicator New Moving Mini-Max technical analysis indicator and its implementation in MQL5. It is not realistic to deal with such an indicator on the real course, but it would be a nice thing to test it on a simple model with a constant trend.
...Whether to take a discrete or continuous model is a matter of taste. They're the same. Only one model has integrals and the other sums. And the coin model is already understood by schoolchildren, and the continuous model only by students...
that's where the mistake lies.
1. the transition from the continuous model to the discrete model must be done correctly.
2. Both models can be the same (continuous and discrete), but it is necessary to fulfil the condition, the step in + and in - must be the same. Its magnitude.
3. took bars to analyse, that your statement would be true "They are the same. Only one model has integrals and the other has sums." Prove that all bars are the same. Can you prove it?
4. only one chart has this property, the renko chart...you can replace it with +1 -1(https://www.mql5.com/en/code/9447#25419).
Thanks for the link to the article. I have read it. It suggests using the ARFIMA model, you random walk. These are different models. It would be interesting to read the following article, both yours and the author's. Where it is proved that your proposed market models are adequate. Not just asserted in words, but proved mathematically ... and given the calculation of this figure ...
H.Y. Just many people grasp this beautiful word adequacy, but how to calculate it even do not know. You wrote in your post that 100% adequate model does not exist. I absolutely agree with you. The question is how much the proposed model is adequate to the market by 20, 30 or 99.999999999%....
Try to model a stack, the stack has a clear structure, the stack sees orders for a certain number of points up and down.
Generator passes through all cells (it can be not +1 -1 but generation of random volumes), then after all cells of the stack are passed by the generator, the calculation of where to move the middle point of the stack is made.
And don't forget to restart SRAND after generating 32768 rand, otherwise your sequence will be repeated.
- Free trading apps
- Over 8,000 signals for copying
- Economic news for exploring financial markets
You agree to website policy and terms of use
New article Random Walk and the Trend Indicator is published:
Random Walk looks very similar to the real market data, but it has some significant features. In this article we will consider the properties of Random Walk, simulated using the coin-tossing game. To study the properties of the data, the trendiness indicator is developed.
Author: Гребенев Вячеслав