How can I change Fibonacci levels display colour?
You need to add the code to the help (OBJ_FIBO). Like this:
//--- create an object
   if(!FiboLevelsCreate(0,InpName,0,date[d1],price[p1],date[d2],price[p2],InpColor,
                        InpStyle,InpWidth,InpBack,InpSelection,InpRayLeft,InpRayRight,InpHidden,InpZOrder))
     {
      return;
     }
//---
   int levels                 = 3;                                   // number of level lines
   double values[3]           = {0.0,0.236,0.382};                   // values of level lines
   color colors[3]            = {clrAliceBlue,clrBlue,clrRed};       // color of level lines
   ENUM_LINE_STYLE styles[3]  = {STYLE_SOLID,STYLE_DASH,STYLE_DOT};  // style of level lines
   int widths[3]              = {1,2,3};                             // width of level lines
   long chart_ID              = 0;                                   // chart's ID
   string name                = "FiboLevels";                        // object name
   FiboLevelsSet(levels,      // number of level lines
                 values,      // values of level lines
                 colors,      // color of level lines
                 styles,      // style of level lines
                 widths,      // width of level lines
                 chart_ID=0,  // chart's ID
                 name);
//--- redraw the chart and wait for 1 second
   ChartRedraw();
   Sleep(1000);

Documentation on MQL5: Constants, Enumerations and Structures / Objects Constants / Object Types / OBJ_FIBO
- www.mql5.com
//| Create Fibonacci Retracement by the given coordinates | time1=0, price1=0, time2=0, price2=0, width=1, //
"Fibo level line colors" are not changing.
below is the code.
below is the code.
//+------------------------------------------------------------------+
//| Expert tick function                                             |
//+------------------------------------------------------------------+
void OnTick()
  {

   double            Fibo_Levels[5] = {0.0,0.214,0.50,0.786,1.00};
   color             Fibo_LvlCol[5] = {clrAntiqueWhite,clrAntiqueWhite,clrAqua,clrYellowGreen,clrYellowGreen};
   int               Fibo_LvlThk[5] = {1,3,3,3,1};
   ENUM_LINE_STYLE   Fibo_LvlSty[5] = {STYLE_SOLID,STYLE_SOLID,STYLE_SOLID,STYLE_SOLID,STYLE_SOLID};
   string            fibo_name = "Fibonacci: " + IntegerToString(DayOfYear());

   if(ObjectFind(0,fibo_name)<0)
     {

      double   rec_price1 = iHigh(_Symbol,PERIOD_H1,iHighest(_Symbol,PERIOD_H1,MODE_HIGH,3,1)),
               rec_price2 = iLow(_Symbol,PERIOD_H1,iLowest(_Symbol,PERIOD_H1,MODE_LOW,3,1));
      datetime rec_time1 = iTime(_Symbol,PERIOD_H1,3), rec_time2 = iTime(_Symbol,PERIOD_H1,1);

      rec_price1 = NormalizeDouble(rec_price1,_Digits);
      rec_price2 = NormalizeDouble(rec_price2,_Digits);


      if(FiboLevelsCreate(0,fibo_name,0,rec_time1,rec_price1,rec_time2,rec_price2,5))
        {
         FiboLevelsSet(5,Fibo_Levels,Fibo_LvlCol,Fibo_LvlSty,Fibo_LvlThk);

         //--- redraw the chart and wait for 1 second
         ChartRedraw();
         Sleep(1000);
        }
     }
  }
//+------------------------------------------------------------------+
//| Create Fibonacci Retracement by the given coordinates            |
//+------------------------------------------------------------------+
bool FiboLevelsCreate(const long            chart_ID=0,        // chart's ID
                      const string          name="FiboLevels", // object name
                      const int             sub_window=0,      // subwindow index
                      datetime              time1=0,           // first point time
                      double                price1=0,          // first point price
                      datetime              time2=0,           // second point time
                      double                price2=0,          // second point price
                      const color           clr=clrRed,        // object color
                      const ENUM_LINE_STYLE style=STYLE_SOLID, // object line style
                      const int             width=1,           // object line width
                      const bool            back=false,        // in the background
                      const bool            selection=true,    // highlight to move
                      const bool            ray_right=false,   // object's continuation to the right
                      const bool            hidden=true,       // hidden in the object list
                      const long            z_order=0)         // priority for mouse click
  {
//--- reset the error value
   ResetLastError();
//--- Create Fibonacci Retracement by the given coordinates
   if(!ObjectCreate(chart_ID,name,OBJ_FIBO,sub_window,time1,price1,time2,price2))
     {
      Print(__FUNCTION__,
            ": failed to create \"Fibonacci Retracement\"! Error code = ",GetLastError());
      return(false);
     }
//--- set color
   ObjectSetInteger(chart_ID,name,OBJPROP_COLOR,clr);
//--- set line style
   ObjectSetInteger(chart_ID,name,OBJPROP_STYLE,style);
//--- set line width
   ObjectSetInteger(chart_ID,name,OBJPROP_WIDTH,width);
//--- display in the foreground (false) or background (true)
   ObjectSetInteger(chart_ID,name,OBJPROP_BACK,back);
//--- enable (true) or disable (false) the mode of highlighting the channel for moving
//--- when creating a graphical object using ObjectCreate function, the object cannot be
//--- highlighted and moved by default. Inside this method, selection parameter
//--- is true by default making it possible to highlight and move the object
   ObjectSetInteger(chart_ID,name,OBJPROP_SELECTABLE,selection);
   ObjectSetInteger(chart_ID,name,OBJPROP_SELECTED,selection);
//--- enable (true) or disable (false) the mode of continuation of the object's display to the right
   ObjectSetInteger(chart_ID,name,OBJPROP_RAY_RIGHT,ray_right);
//--- hide (true) or display (false) graphical object name in the object list
   ObjectSetInteger(chart_ID,name,OBJPROP_HIDDEN,hidden);
//--- set the priority for receiving the event of a mouse click in the chart
   ObjectSetInteger(chart_ID,name,OBJPROP_ZORDER,z_order);
//--- successful execution
   return(true);
  }
//+------------------------------------------------------------------+
//| Set number of levels and their parameters                        |
//+------------------------------------------------------------------+
bool FiboLevelsSet(int             levels,            // number of level lines
                   double          &values[],         // values of level lines
                   color           &colors[],         // color of level lines
                   ENUM_LINE_STYLE &styles[],         // style of level lines
                   int             &widths[],         // width of level lines
                   const long      chart_ID=0,        // chart's ID
                   const string    name="FiboLevels") // object name
  {
//--- check array sizes
   if(levels!=ArraySize(colors) || levels!=ArraySize(styles) ||
      levels!=ArraySize(widths) || levels!=ArraySize(widths))
     {
      Print(__FUNCTION__,": array length does not correspond to the number of levels, error!");
      return(false);
     }
//--- set the number of levels
   ObjectSetInteger(chart_ID,name,OBJPROP_LEVELS,levels);
//--- set the properties of levels in the loop
   for(int i=0; i<levels; i++)
     {
      //--- level value
      ObjectSetDouble(chart_ID,name,OBJPROP_LEVELVALUE,i,values[i]);
      //--- level color
      ObjectSetInteger(chart_ID,name,OBJPROP_LEVELCOLOR,i,colors[i]);
      //--- level style
      ObjectSetInteger(chart_ID,name,OBJPROP_LEVELSTYLE,i,styles[i]);
      //--- level width
      ObjectSetInteger(chart_ID,name,OBJPROP_LEVELWIDTH,i,widths[i]);
      //--- level description
      ObjectSetString(chart_ID,name,OBJPROP_LEVELTEXT,i,DoubleToString(100*values[i],1));

      Print(values[i],"  ",colors[i],"  ",styles[i],"  ",widths[i]);
     }
//--- successful execution
   return(true);
  }
Files:
Screenshot_2.png
37 kb
You are missing trading opportunities:
- Free trading apps
- Over 8,000 signals for copying
- Economic news for exploring financial markets
Registration
Log in
You agree to website policy and terms of use
If you do not have an account, please register
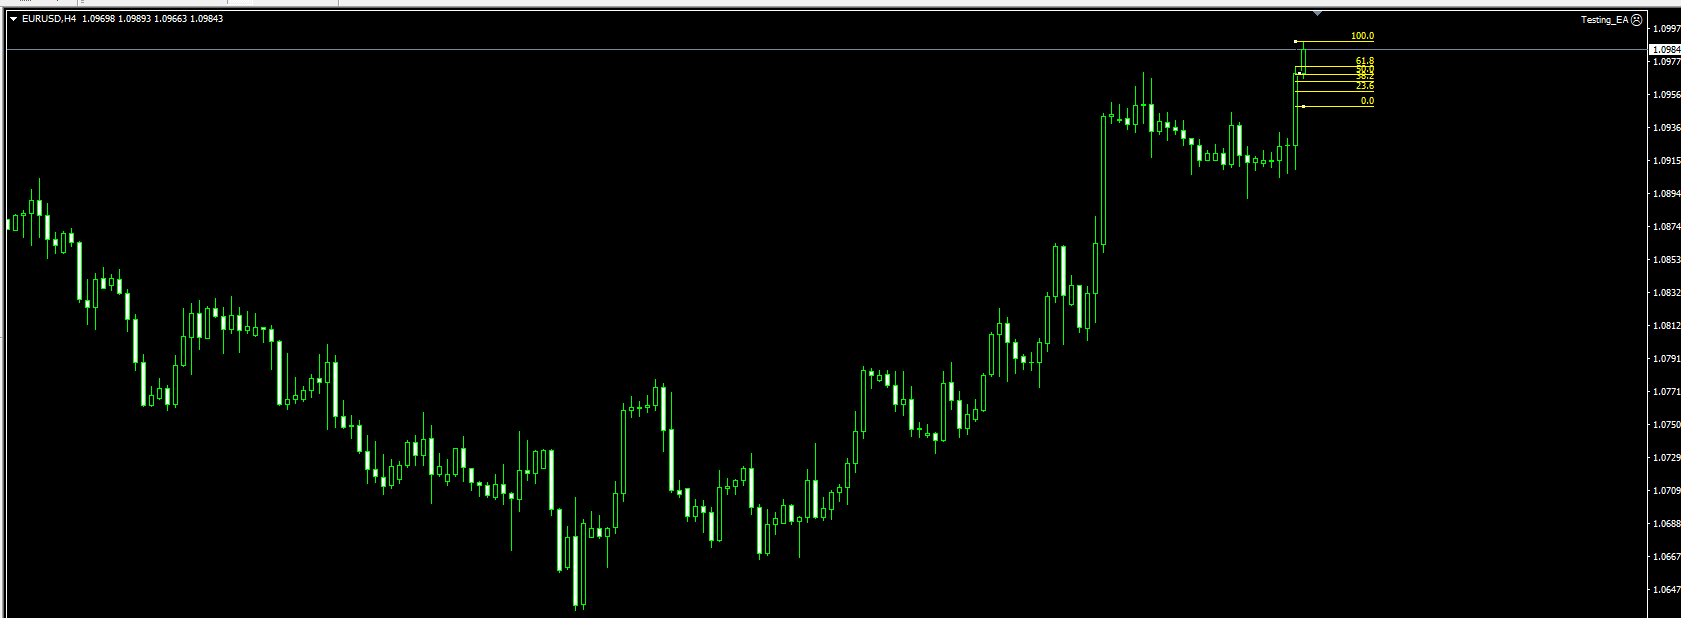
I tried to change the Fibonacci display color but it only changes the color of the diagonal line across the levels as in the image below. How can I change the level colors? Please see my relevant code below: