Down loaded the file and just shows a blue line.
If your background chart color is black , change the black color of the indicator to a lighter color.
Its in the color 1 & 2 of the style that has dots. change it from Black to white.
Perfect idea!
Thank you!
Perfect!
i't lack of notification method , so i refactor it by myself with some Notification method in Indicator
It's also require more tunning to good for pairs in used
   for( int i=0; i<limit; i++ ) {
      bool BuyArrow  = ExtRSI[i]>ExtDn[i] && ExtRSI[i+1]<=ExtDn[i+1];
      bool SellArrow = ExtRSI[i]<ExtUp[i] && ExtRSI[i+1]>=ExtUp[i+1];

      if( BuyArrow )  {
         ExtBuyArrow[i]  = ExtDn[i];
         if(PrevHrs != Hour()) {
            SendNotification("Check Trend to BUY "+ Symbol() +" At " + Ask);
            PrevHrs = Hour();
            }
         }
      if( SellArrow ) {
         ExtSellArrow[i] = ExtUp[i];
         if(PrevHrs != Hour()) {
            SendNotification("Check Trend to SELL "+ Symbol() +" At " + Bid);
            PrevHrs = Hour();
            }
         }
   }
Hi Fabio,
Is it possible to add a centre line for the BB.
Thanks for the indicator.
Hi Fabio,
Is it possible to add a centre line for the BB.
Thanks for the indicator.
Hello!
Middle line is already coded. Download latest version.
Hello!
Middle line is already coded. Download latest version.
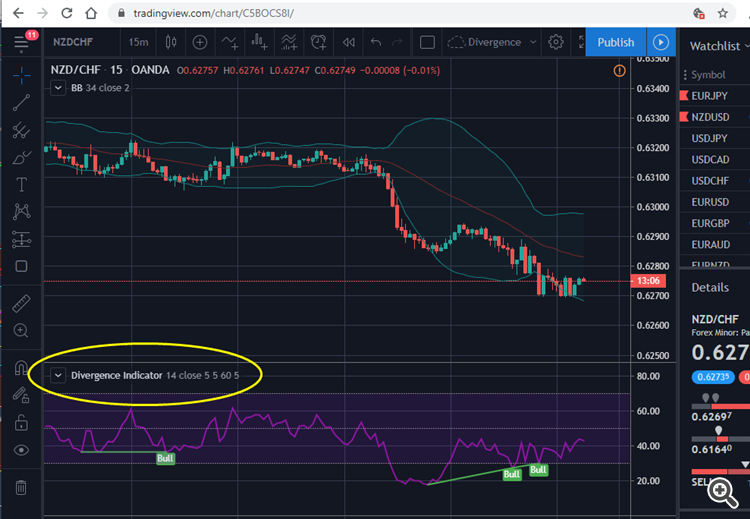
I saw this in TradingView.,
Can you do a RSI Divergence Indicator as below picture
Search on codebase or on market... there are a lot of rsi divergence indicators
Search on codebase or on market... there are a lot of rsi divergence indicators
- Free trading apps
- Over 8,000 signals for copying
- Economic news for exploring financial markets
You agree to website policy and terms of use

RSI with BB:
A very simple indicator with RSI and Bollinger Bands calculated on RSI values.
Author: Fabio Cavalloni