optimal reward/risk ratio

- 2012.09.27
- www.mql5.com
Regarding the colors, I think you want to have full red on max expectancy and full blue on min. This should do it:
double scale0to1=(expectancy[sl][tp]-min_expectancy)/(max_expectancy-min_expectancy);
red=127+(int)(scale0to1*127);
blue=127+(int)((1-scale0to1)*127);
Although I'd associate red with losses. :)
And the last line where you remember the loser, shouldn't it read losers[sl]...? Why loop with tp?
Regarding the colors, I think you want to have full red on max expectancy and full blue on min. This should do it:
Although I'd associate red with losses. :)
And the last line where you remember the loser, shouldn't it read losers[sl]...? Why loop with tp?
Alain+lippmaje, thanks for your answers.
I understand what you're saying about the spread; I also would have expected the spread to be more relevant; I checked with an insanely high simulated spread (20 pips) just for test purposes and verified that it does show an effect, but I suspect that still something isn't correct.
Why do I loop the TP for the losers? This makes sense because all settings with a higher TP than the given max. positive excursion are also counted as losers any time their target wasn't reached, i.e. any time the SL is reached earlier, which is the condition here given by "pips<min", defining a new low.
Red's hot ;-)
"Why do I loop the TP for the losers? ..." Ok, I see it.
You're using the 1. dimension for SL, so you should handle the losers array accordingly in the loop.
And since pips and max are doubles, even small advances of the extremes trigger the loops, counting the same winners/losers again.
   if(pips>=max+1)
     {
      max=pips;
      for(int sl=int(start-min+1); sl<max_pips; sl++)
        {
         winners[sl][deviation]++;
        }
     }
   if(pips<=min-1)
     {
      min=pips;
      for(int tp=int(max-start+1); tp<max_pips; tp++)
        {
         losers[-deviation][tp]++;
        }
     }
And I think it should be max+=1 instead of max=pips to get a proper progression, likewise min-=1.
I did a small backtest to produce a map with EURUSD/M5 'random' trades for 3 months. SL/TP ranging from 1 to 60 pips. Entry condition was a
Stochastic up/down cross.
Maybe it provides some insight.
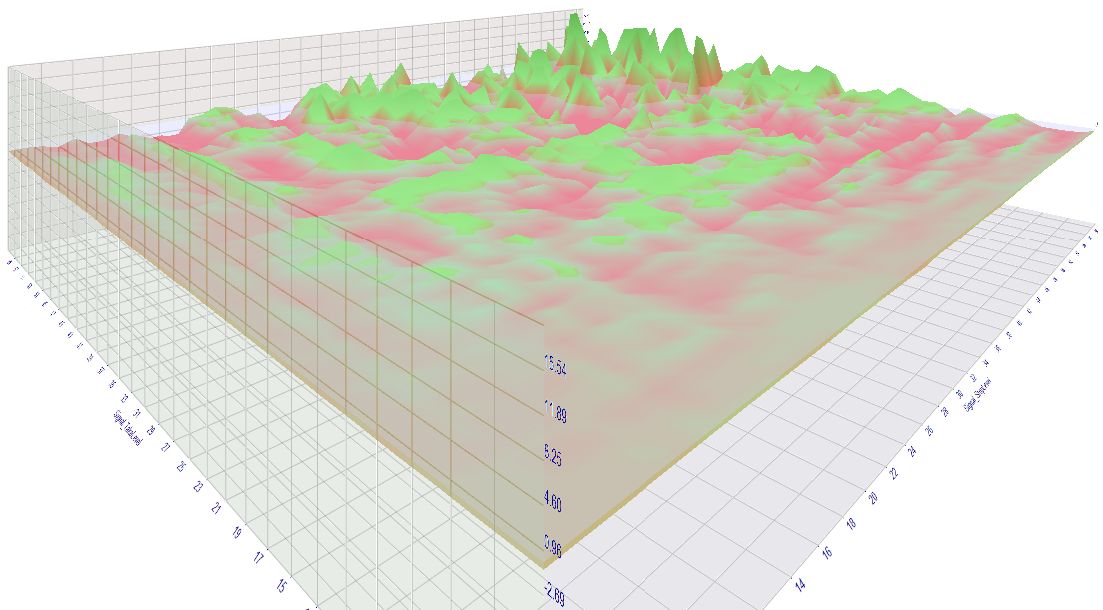
You see the lower the values for SL or TP, the lower the expectancy to get any gains. (1. picture, front/low corner is axes origin)
It's not shown in the picture but the low TP/SL settings racked up the most losses, due to their higher trade frequency.
The higher SL and TP, the greater is the chance to reach a nice profit.
Some of that settings had a profit factor of over 2 - not bad for an entry based on a simple Stochastic cross.
This also questions the soundness of short-term strategies/scalpers.
The tests were carried out with real ticks and an average 0,6 spread, swaps included.
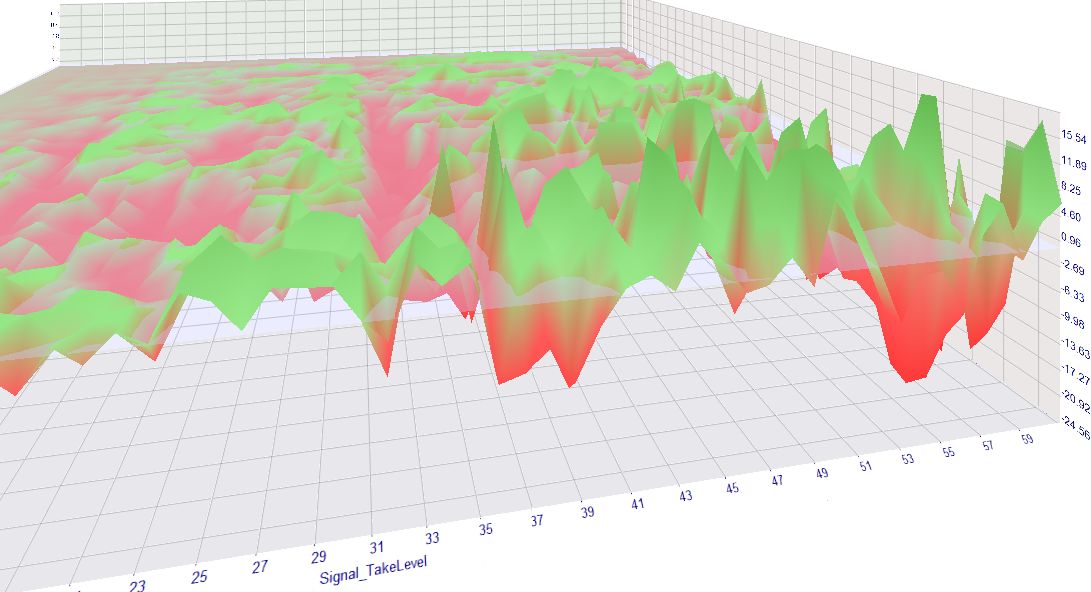
Profits of this setup (lot size 0.1):

You see that the low SL/TP settings rack up huge losses - with every trade on average you lose a small amount (approx the spread) which sums up to huge losses due to the trade frequency (5-6K trades).
The high SL/TP settings at least "permit" for a decent profit - oftentimes 20 $ per 0.1 traded lot.
Thanks for the work and the thoughts you put into it!
It's not surprising that very tight stops are never a good thing, leading to a high trading frequency consisting of many small losses adding up. This is the obvious part.
What is more interesting (/less obvious) is the answer to the question if the opposite scenario with tight take profits and distant stop loss is better than a more even ratio or the "classic" ratio with a medium size SL distance and a 2-3 fold TP distance.
If my "heatmap" is correct, this actually shows that the classic method is better than an inverse SL/TP ratio (just for the stochastic case, without any strategy). I cannot read the axes titles in your pictures. Can you confirm the same finding?
In my opinion there is no such thing as optimal ratio in general sense. It totally depends on the strategy and to a certain extend the money management and personal preference.
If entries are accurate enough, one can get away with a lower reward vs risk. If not very accurate going below 1:1 will probably drain the account in the long run.
Then there is the psychological issue. Higher reward ratios statistically have a lower win rate which can be difficult for people to deal with.
For me personally win rate below 50% is outside my comfort zone.
The probability to lose is for sure against you if you work with a low TP or low SL. If you're really good at predicting the future you may defy the odds for some time but I doubt you'll get away with a long-term profit.
The results didn't show anything profitable for low TPs, see the graph. TP is left going from 1..60 pips and SL right 2..60 (spread included). The image viewer crashed and I was too lazy to draw the markup again. :p
It would be nice to see some more details.
- Free trading apps
- Over 8,000 signals for copying
- Economic news for exploring financial markets
You agree to website policy and terms of use
I'd like to share some thoughts about an "optimal" reward/risk ratio from a statistical point of view, in a general scenario (without looking at specific strategies, currency pairs...) and am curious what you think about it.
We all want to maximize our profits and minimize our losses. When it comes to the reward/risk ratio, obviously a high reward is desirable. However, a high target isn't worth much if reality shows that it is never reached. The extreme example are very tight stops that are triggered all the time and prevent us from ever reaching the target, even if our evaluation of the trend direction was correct: we're stopped out, only to realize that shortly afterwards the price does exactly what we initially expected.
The other extreme consists of very tight targets. Everything is perfect as long as they keep on being reached, but then a few big losers kill all previous profits.
To summarize, there seems to be an inverse relationship between the distance of a target (or stop loss) and the probability of it being reached before the opposite event. This is why - if we think about it - it makes sense to ask if the product of target size multiplied by target probability is constant. If one part of the product gets bigger, the other one as a tradeoff usually is lower.
On the other hand, if we think of the price as "signal plus noise", it's also worth a consideration if maybe price targets (TP or SL) that are VERY close to the initial price are more often caught up in "noise" despite the general trend and therefore maybe have an over-proportionally high probability, so that the product of (low) size * (high) probability might be actually be a little higher in such cases.
So now what? Is the relationship a constant or not? Let's go for a test and create a little "heatmap" of the empirically best TP/SL combinations! It's no sophisticated code, just something I quickly wrote, but I think it does the job.
I do it only for the "buy" side and with randomly simulated entries. The following code counts the winners and losers for given SL/TP setting and then computes the average expectancy for each setting (1 square represents 1.0 pips, SL on the x axis, TP on the y axis, upper left corner representing "zero", red=positive expectancy, blue=negative):
This is with EURUSD, other currency pairs lead to similar results (as long as there are no strong long term trends). So - if I didn't make any errors - empirically we see, that the relationship in fact isn't constant and that it actually makes sense to aim for a higher reward/risk ratio (=lower left corner) and that the lower probabilities of reaching those targets are more than compensated by their size.
Does anybody find any errors? Any thoughts?