Display several lines of Comments
Hi there, in have a Comment at the end of each module of the current code I'm working on, and I like to display each one below another.
Tried by adding +"\n" at the end of the line but don't actually working, must say it's not a single comment of several lines but some Comments at the end of each module and need to display each one below another. At this moment last one is overwriting previous.
Thank you in advance, David.
void ChartComm() // function: write comments on the chart
  {
//----
   //--
   Comment("\n     :: Server Date Time : ",(string)Year(),".",(string)Month(),".",(string)Day(), "   ",TimeToString(TimeCurrent(),TIME_SECONDS),
      "\n     ------------------------------------------------------------",
      "\n      :: Broker             :  ", TerminalCompany(),
      "\n      :: Acc. Name       :  ", AccountName(),
      "\n      :: Acc, Number    :  ", (string)AccountNumber(),
      "\n      :: Acc,TradeMode :  ", AccountMode(),
      "\n      :: Acc. Leverage   :  1 : ", (string)AccountLeverage(),
      "\n      :: Acc. Balance     :  ", DoubleToString(AccountBalance(),2),
      "\n      :: Acc. Equity       :  ", DoubleToString(AccountEquity(),2),
      "\n     --------------------------------------------",
      "\n      :: Indicator Name  :  ",iname,
      "\n      :: Currency Pair    :  ",_Symbol,
      "\n      :: Current Spread  :  ",IntegerToString(SymbolInfoInteger(_Symbol,SYMBOL_SPREAD),0),
      "\n      :: Signal Start       : at bar ",string(iBarShift(_Symbol,0,pbartime,false)),
      "\n      :: Price Start        :  "+frtext+DoubleToString(pricepos,_Digits),
      "\n      :: Indicator Signal :  ",posisi,
      "\n      :: Suggested        :  ",sigpos);
   //---
   ChartRedraw();
   return;
//----
  } //-end ChartComm()
//---------//
use global string, e.g.
It seems a nice way to do what I need, but could you specify how does it work that about 'reset'?
P.D.: I can't use string as advisor comments are including formulas.

- www.mql5.com
This worked for me so far, thanks Pawel.
If you want more options, I wrote this function for this purpose:
int chart_print(string text,int identifier=-1,int x_pos=-1,int y_pos=-1,int fontsize=10,int linespace=2,color fontcolor=clrGray,string font="Arial",string label_prefix="chart_print_",long chart_id=0,int subwindow=0)
  {
   // set message identifier
   //       negative number:      set next identifier
   //       specific number >=0:  replace older messages with same identifier
   static int id=0;
   static int x_static=0;
   static int y_static=0;
   if (identifier>=0)
     {id=identifier;}
   else
     {id++;}
   ObjectsDeleteAll(0,label_prefix+IntegerToString(id));

   if (text!="") //note: chart_print("",n) can be used to delete a specific message
     {
      // initialize or set cursor position
      //       keep last line feed position: set negative number for y_pos
      //       same x position as last message: set negative number for x_pos
      if (x_pos>=0){x_static=x_pos;}
      if (y_pos>=0){y_static=y_pos;}

      // get number of lines ('#' sign is used for line feed)
      int lines=1+MathMax(StringReplace(text,"#","#"),0);

      // get substrings
      string substring[];
      StringSplit(text,'#',substring);

      // print lines
      for (int l=1;l<=lines;l++)
        {
         string msg_label=label_prefix+IntegerToString(id)+", line "+IntegerToString(l);
         ObjectCreate(chart_id,msg_label,OBJ_LABEL,subwindow,0,0);
         ObjectSetInteger(chart_id,msg_label,OBJPROP_XDISTANCE,x_static);
         ObjectSetInteger(chart_id,msg_label,OBJPROP_YDISTANCE,y_static);
         ObjectSetInteger(chart_id,msg_label,OBJPROP_CORNER,CORNER_LEFT_UPPER);
         ObjectSetString(chart_id,msg_label,OBJPROP_TEXT,substring[l-1]);
         ObjectSetString(chart_id,msg_label,OBJPROP_FONT,font);
         ObjectSetInteger(chart_id,msg_label,OBJPROP_FONTSIZE,fontsize);
         ObjectSetInteger(chart_id,msg_label,OBJPROP_ANCHOR,ANCHOR_LEFT_UPPER);
         ObjectSetInteger(chart_id,msg_label,OBJPROP_COLOR,fontcolor);
         ObjectSetInteger(chart_id,msg_label,OBJPROP_BACK,false);
         // line feed
         y_static+=fontsize+linespace;
        }
     }
   return y_static;
  }
I can highly recommend this method, because although these are just very few lines of code it is very versatile and offers much more than the built-in "comment" function.
You can print anything anywhere on the chart and can even chose font type, font color, font size and line space. For me, this method has replaced the "comment" function completely.
Let me explain the options in detail:
If you want to write multiple text lines with a single function call, just use "#" as a separator, e.g.
chart_print("line 1#line 2");
alternatively:
chart_print("line 1",0);
chart_print("line 2",1);
as you can see, I used here 0 and 1 (or any other positive integer) as identifiers for individual handling of the function calls in order to allow for separate labeling, which is necessary for assigning different font styles. Furthermore the identifiers are useful for deleting individual lines while keeping all other lines:
if we use an empty string (""), the line with this ID will be deleted, e.g. in order to delete "line 1" simply write
chart_print("",1);
If no ID is specified, the next following free ID will just be chosen automatically.
If the same ID as in the last call is used (like e.g. with every call of the OnTick function) this means that the previous line with this ID is replaced by the new text (just like with the built-in comment function).
There is also the option to assign a prefix for the text line labeling, which allows for handling groups of text lines via calling ObjectsDeleteAll using the given prefix.
The position (x and y coordinates in pixels) of a text line can be given such as e.g. at anchor point 30/30:
chart_print("line 0",0,30,30);
The beauty: if we want to write several lines there is no need to keep track of the previous position: if we set the value for the x-position to -1 (or any other negative number), this means the next line will have the same x position as in the last function call. After writing a line, the y position (=the "cursor") performs an automatic line feed, so if we don't want to calculate what the next correct y coordinate is, we can just select -1 for the y position and the next line will just be written below the previous line (you can use the value for the "line feed" operator if you want a specific pixel distance).
The return value of the function is the last cursor position (y coordinate), which sometimes can be useful, for example if you want to place a graphical object relative to this text.
Another example:
chart_print("this is an example with a different font style#   (Arial Black with fontsize 20)",-1,30,30,20,5,clrRed,"Arial Black");
chart_print("or like this...#   (Arial with font size 15)",-1,-1,-1,15,5,clrGreen,"Arial");
chart_print("or like this...#   (Courier with font size 30)",-1,-1,-1,30,5,clrBlue,"Courier");
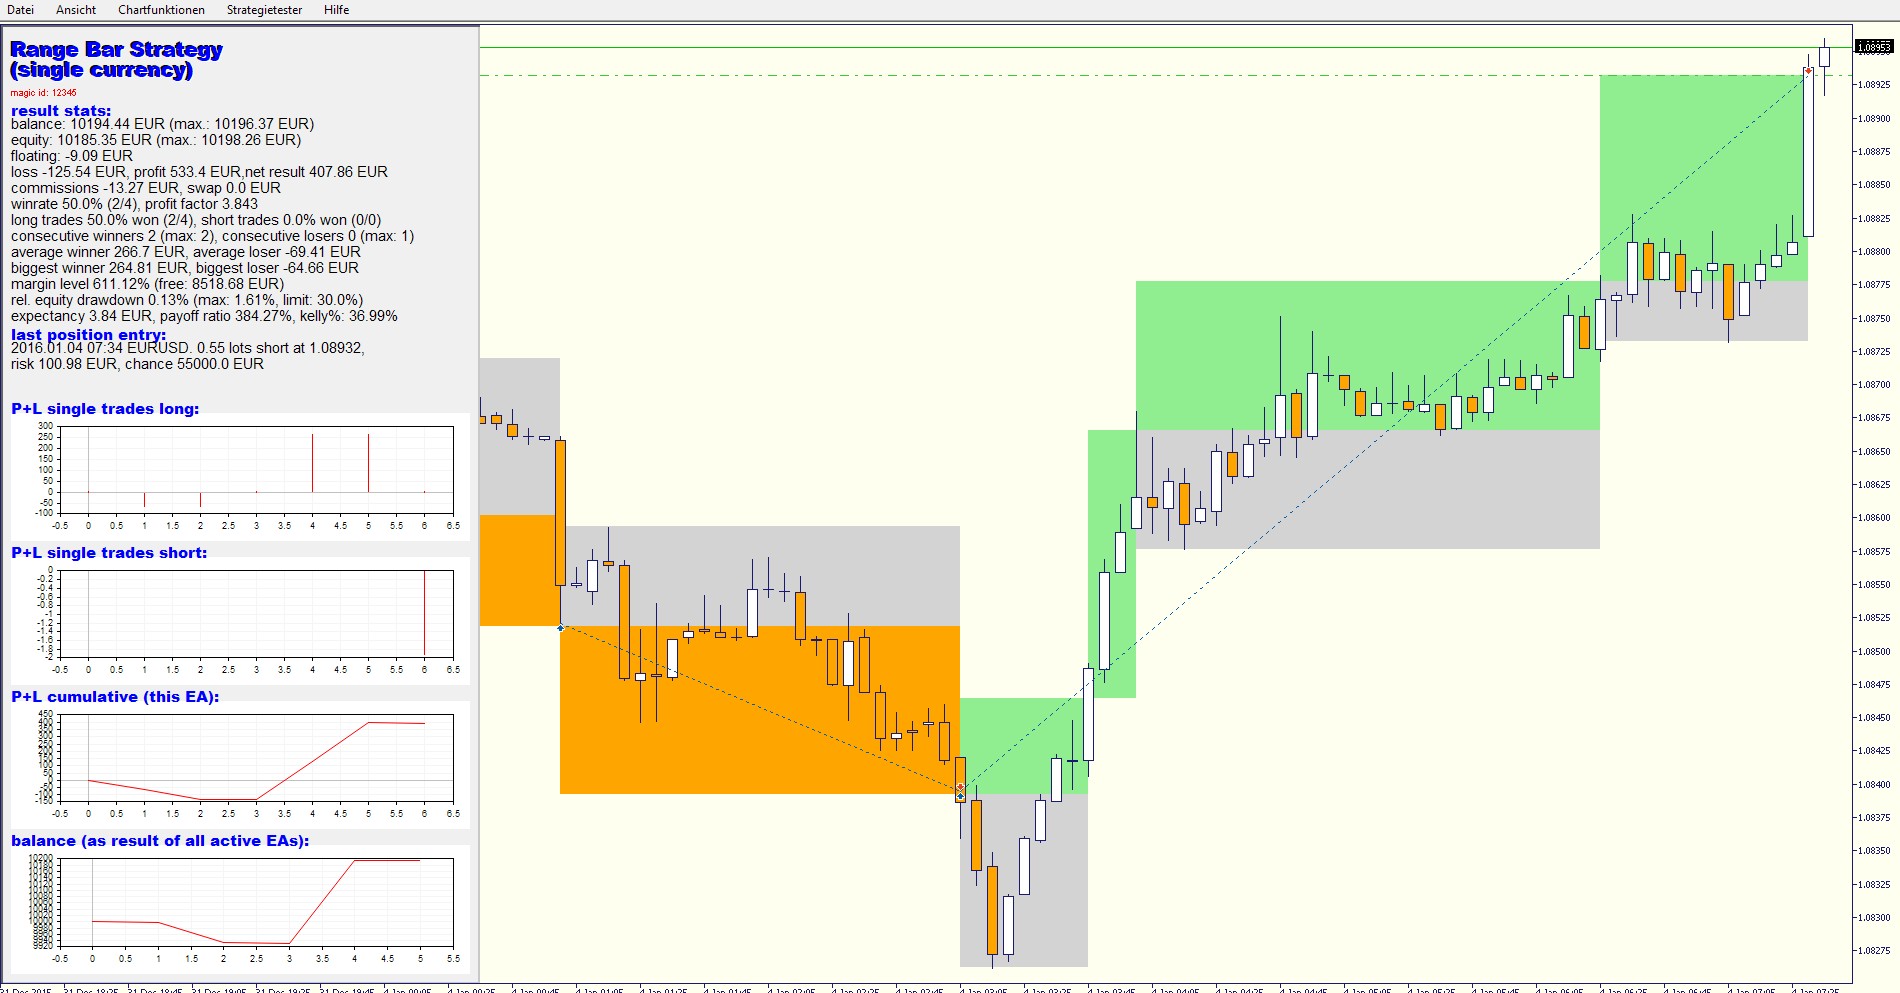
If you want to try out the function, here is an example of what it can do (the text positions and font sizes in this example are relative to the chart size and zoom automatically); all the blue/red/black text on the left was written by using this simple function (with an OBJECT_RECTANGLE_LABEL object as the box in the background):
It seems a nice way to do what I need, but could you specify how does it work that about 'reset'?
P.D.: I can't use string as advisor comments are including formulas.
- Free trading apps
- Over 8,000 signals for copying
- Economic news for exploring financial markets
You agree to website policy and terms of use
Hi there, in have a Comment at the end of each module of the current code I'm working on, and I like to display each one below another.
Tried by adding +"\n" at the end of the line but don't actually working, must say it's not a single comment of several lines but some Comments at the end of each module and need to display each one below another. At this moment last one is overwriting previous.
Thank you in advance, David.