Indicators: Doji_Arrows
Forum on trading, automated trading systems and testing trading strategies
Libraries: MQL5 Wizard - Candlestick Patterns Class
newdigital, 2013.09.13 15:57
The Dragonfly Doji is a significant bullish reversal candlestick pattern that mainly occurs at the bottom of downtrends.
The Dragonfly Doji is created when the open, high, and close are the same or about the same price (Where the open, high, and close are exactly the same price is quite rare). The most important part of the Dragonfly Doji is the long lower shadow.
The long lower shadow implies that the market tested to find where demand was located and found it. Bears were able to press prices downward, but an area of support was found at the low of the day and buying pressure was able to push prices back up to the opening price. Thus, the bearish advance downward was entirely rejected by the bulls.
Dragonfly Doji Candlestick Chart ExampleThe chart below of the mini-Dow Futures contract illustrates a Dragonfly Doji occuring at the bottom of a downtrend:
In the chart above of the mini-Dow, the market began the day testing to find where demand would enter the market. The mini-Dow eventually found support at the low of the day, so much support and subsequent buying pressure, that prices were able to close the day approximately where they started the day.
The Dragonfly Doji is an extremely helpful Candlestick pattern to help traders visually see where support and demand is located. After a downtrend, the Dragonfly Doji can signal to traders that the downtrend could be over and that short positions should probably be covered. Other indicators should be used in conjunction with the Dragonfly Doji pattern to determine buy signals, for example, a break of a downward trendline.
The bearish version of the Dragonfly Doji is the Gravestone DojiForum on trading, automated trading systems and testing trading strategies
Libraries: MQL5 Wizard - Candlestick Patterns Class
newdigital, 2013.09.16 08:38
The Gravestone Doji is a significant bearish reversal candlestick pattern that mainly occurs at the top of uptrends.
The Gravestone Doji is created when the open, low, and close are the same or about the same price (Where the open, low, and close are exactly the same price is quite rare). The most important part of the Graveston Doji is the long upper shadow.
The long upper shadow is generally interpreted by technicians as meaning that the market is testing to find where supply and potential resistance is located.
The construction of the Gravestone Doji pattern occurs when bulls are able to press prices upward.
However, an area of resistance is found at the high of the day and selling pressure is able to push prices back down to the opening price. Therefore, the bullish advance upward was entirely rejected by the bears.
Gravestone Doji ExampleThe chart below of Altria (MO) stock illustrates a Gravestone Doji that occured at the top of an uptrend:
In the chart above of Altria (MO) stock, the market began the day testing to find where support would enter the market. Altria eventually found resistance at the high of the day, and subsequently fell back to the opening's price.
The Gravestone Doji is an extremely helpful Candlestick reversal pattern to help traders visually see where resistance and supply is likely located. After an uptrend, the Gravestone Doji can signal to traders that the uptrend could be over and that long positions should probably be exited. But other indicators should be used in conjunction with the Gravestone Doji pattern to determine an actual sell signal. A potential trigger could be a break of the upward trendline support.
The reverse of the Gravestone Doji is the bullish Dragonfly DojiForum on trading, automated trading systems and testing trading strategies
Something Interesting in Financial Video November 2013
newdigital, 2013.11.16 08:06
Candlesticks - Vol 9 - Doji
Forum on trading, automated trading systems and testing trading strategies
newdigital, 2014.05.08 12:58
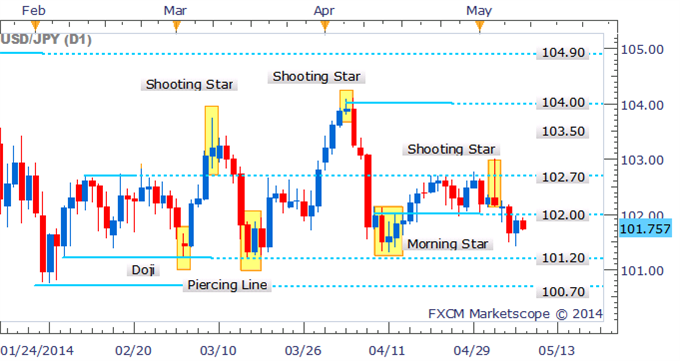
USD/JPY Bears In Control Sub 102.00 With Reversal Signal Lacking
- USD/JPY Technical Strategy: Shorts Preferred
- Prices break below 102.00 following Shooting Star pattern
- Doji suggests some hesitation from the bears in intraday trade
USD/JPY remains below the psychologically-significant 102.00 handle with the absence of a bullish reversal signal making a bounce look unlikely at this stage. Further declines may be met by buying support at the 101.20 mark.
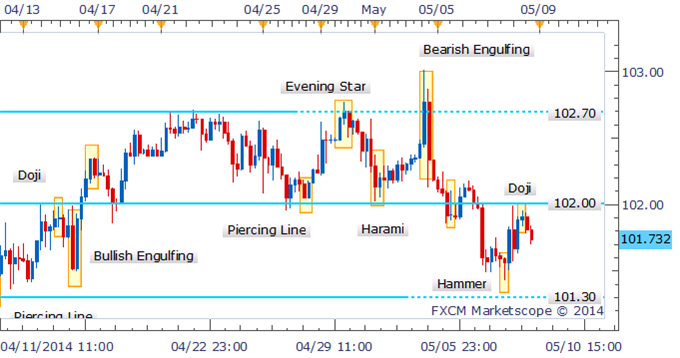
USD/JPY: Open To Further Declines With Bullish Candlestick Missing :
Examining the four hour chart; the Doji near 102.00 signaled a lack of conviction amongst the bulls near the key resistance level. With a bullish reversal pattern also absent in intraday trade, the potential for a bounce may be limited.
USD/JPY: Bulls Lose Steam On Retest Of 102.00 :
- Free trading apps
- Over 8,000 signals for copying
- Economic news for exploring financial markets
You agree to website policy and terms of use
Doji_Arrows:
The indicator finds Doji candlesticks and highlights them on a chart using colored arrows.
Author: Nikolay Kositsin