Which painbar or template indicator is this?
NonLag Inverse Fisher Transform of RSX - indicator for MetaTrader 5
NonLag Inverse Fisher Transform of RSX - indicator for MetaTrader 4
Ehlers inverse fisher transform of RSI - indicator for MetaTrader 5
Ehlers Inverse Fisher Transform - indicator for MetaTrader 5
Thank you very much Who came to help answer questions But the delivery I want to know is I mean the blue and red in the price bar according to the figure. What is the tool or system? Or I noticed that it is not related to the indicator below.
Files:
paintbar.gif
21 kb

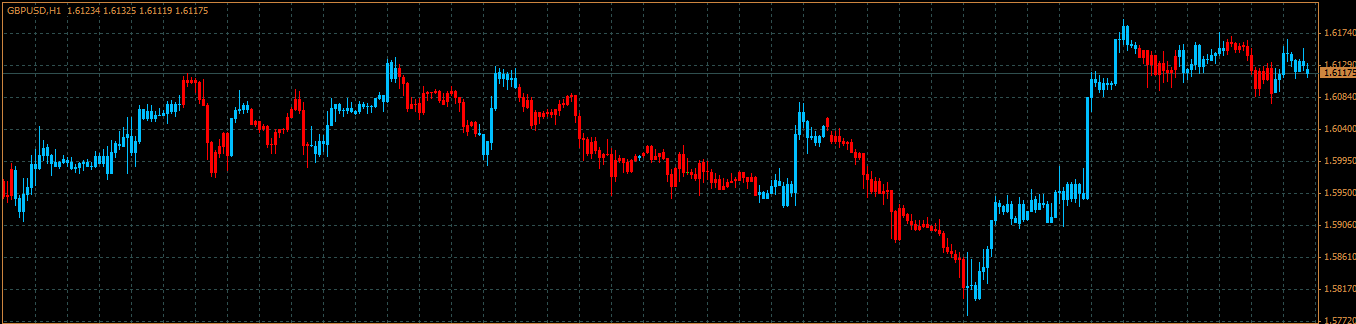
Which painbar or template indicator is this?
https://www.mql5.com/en/forum/173874/page149