Indicator color issue
Impossible to answer without seeing the related code.
Alain Verleyen:
Impossible to answer without seeing the related code.
Impossible to answer without seeing the related code.
Here's the full indicator. The original had Black instead of Red as 2nd color, I changed that to highlight the bars in question.
//+------------------------------------------------------------------+
//|                                             Balance of Power.mq5 |
//|                                           Copyright 2012, RoboFx |
//|                                            http://www.robofx.org |
//+------------------------------------------------------------------+
#property copyright "Copyright 2012, RoboFx"
#property link      "http://www.robofx.org"
#property version   "1.00"

#property indicator_separate_window
#property indicator_buffers 2
#property indicator_plots   1
//--- plot BoP
#property indicator_label1  "BOP"
#property indicator_type1   DRAW_COLOR_HISTOGRAM
#property indicator_color1  clrSteelBlue,clrRed
#property indicator_style1  STYLE_SOLID
#property indicator_width1  2

#include <MovingAverages.mqh>    //--- include moving averages methods

input int BOP_Period = 14;       //--- smoothing period

//--- indicator buffers
double         Buffer1[];        //--- raw data buffer
double         BOP[];            //--- main indicator buffer
//+------------------------------------------------------------------+
//| Custom indicator initialization function                         |
//+------------------------------------------------------------------+
int OnInit()
{
   //--- setting dynamic arrays as indicator buffers
   SetIndexBuffer(0,BOP,INDICATOR_DATA);
   SetIndexBuffer(1,Buffer1,INDICATOR_CALCULATIONS);

   //--- setting the accuracy for indicator values
   IndicatorSetInteger(INDICATOR_DIGITS,_Digits);

   // --- setting the indicator name to be displayed in a separate subwindow
   IndicatorSetString(INDICATOR_SHORTNAME,"Balance of Power ("+string(BOP_Period)+")");
//---
   return(0);
}
//+------------------------------------------------------------------+
//| Custom indicator iteration function                              |
//+------------------------------------------------------------------+
int OnCalculate(const int rates_total,
                const int prev_calculated,
                const datetime &time[],
                const double &open[],
                const double &high[],
                const double &low[],
                const double &close[],
                const long &tick_volume[],
                const long &volume[],
                const int &spread[])
{
//---
   int start;

   //--- check for data
   if(rates_total < BOP_Period) return(0);

   //--- calculations of the starting number limit for the bar recalculation loop
   //--- recalculate the last bar
   if(prev_calculated > 1) start = prev_calculated-1;
   else
   {
      start = 1;
   }

   //--- main indicator calculation loop
   for(int i=start;i<rates_total && !IsStopped();i++)
   {
      //--- avoid zero divide problem in case high == low
      if((high[i]-low[i]) > 0.0)
      {
         //--- calculate raw balance of power for the i-th bar
         Buffer1[i] = (close[i]-open[i])/(high[i]-low[i]);
      }
      else Buffer1[i] = 0;
   }

   // --- smoothing the indicator data using simple moving average
   SimpleMAOnBuffer(rates_total,prev_calculated,0,BOP_Period,Buffer1,BOP);

//--- return value of prev_calculated for next call
   return(rates_total);
}
lippmaje:
Here's the full indicator. The original had Black instead of Red as 2nd color, I changed that to highlight the bars in question.
You are using a color histogram which needs 2 buffers, but you didn't declare or set a colors buffer. The colors are aleatory.
Files:
315390Fixed.mq5
4 kb
That really helped a lot, I had no idea about this strange behavior. I've added a note to the indicator's page. Thank you!
PS: Working like a charm now.
Thanks for the revision. I am enthusiastic.
Comments that do not relate to this topic, have been moved to "Off Topic Posts".
You are missing trading opportunities:
- Free trading apps
- Over 8,000 signals for copying
- Economic news for exploring financial markets
Registration
Log in
You agree to website policy and terms of use
If you do not have an account, please register
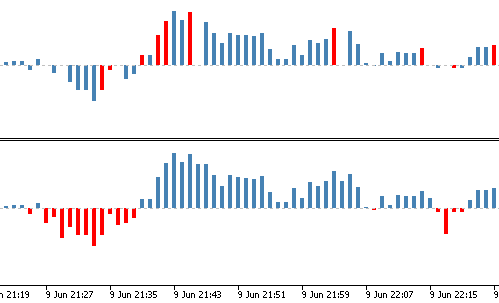
Hi, I'm experiencing a strange thing with a colorized indicator histogram. The histogram is defined like so:
Note the two colors.
In the chart I get a blue histogram, which is fine, but occasionally it shows red bars. And also some bars are not showing although their value is different from zero, like the one highlighted with the mouse in the picture.
Could someone explain this to me?