Indicators: Heatmaps, color gradients and scales in MQL5
Very cool... reminds me of amibroker.
Hi, I'm sharing an update on this
this indicator couldn't show the result in a table for me and more symbols just cant fit in the chart!
Also the last 2 days price change ratio is not interesting
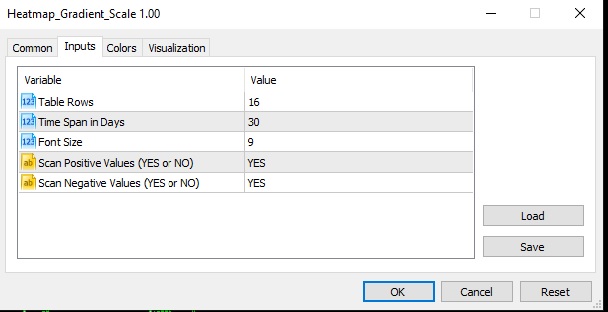
so... i added some inputs
- number of the rows for a table
- number of days taken in calculation
- font size of the text within the table
- user can filter symbols by negative/positive values
Files:
inpust.jpg
40 kb
You are missing trading opportunities:
- Free trading apps
- Over 8,000 signals for copying
- Economic news for exploring financial markets
Registration
Log in
You agree to website policy and terms of use
If you do not have an account, please register
Heatmaps, color gradients and scales in MQL5:
The purpose of this code is to demonstrate how easy it is to create color scales, color gradients and heatmaps with the MQL5 language and functions.
In order to facilitate things, we will work with the RGB color model and the standard conversion function StringToColor.
Other color conversion methods can be implemented in MQL5, however we have decided to use the RGB color model due to the facility to perform mathematical operations on the colors.
Author: Rodrigo Malacarne