Indicators: HighsLowsSignal
Save Money by Getting Better Trade Entries (adapted from dailyfx article)
- Learn how to ‘eyeball’ bullish and bearish trends.
- Trade pullbacks as identified by the Slow Stochastic.
- Set stops beyond closest support/resistance and set limits twice as far.
Today, we will cover how to identify trending markets and then apply the Slow Stochastic to get into trades during pullbacks.
The Trend is Your Friend
Every trader has heard the phrase, “The trend is your friend.” This phrase describes traders that look for instruments moving consistently up or down and then trade in the same direction as the trend. If the trend continues, trend traders make money. If the trend reverses, trend traders lose money. In principle, this is easy, but in practice it is a little more difficult.
Properly identifying trends takes practice. We need to be confident in what constitutes a trend and what invalidates a potential trend. So the two things I look for are:
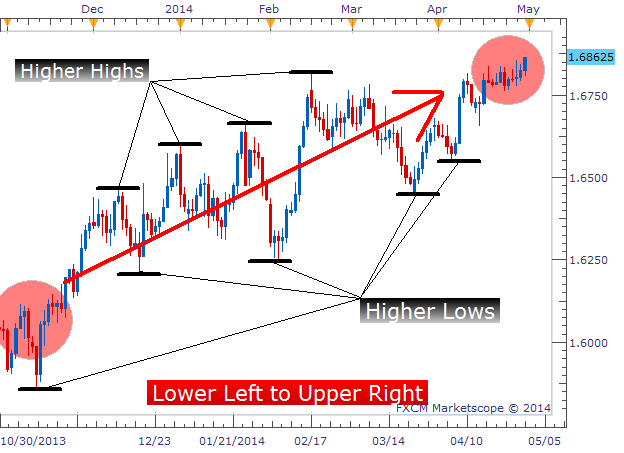
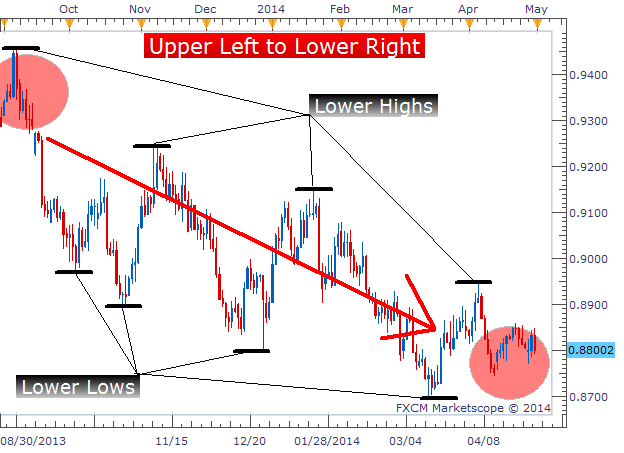
- A general move from lower left to upper right or from upper left to lower right.
- Higher swing highs and higher swing lows or lower swing highs and lower swing lows.
Identifying an Uptrend
Identifying a Downtrend
Using Slow Stochastic to Identify Pullbacks
Once we identify a chart that is trending up or down, we need to add our Slow Stochastic indicator to the chart. I prefer using the settings (15, 5, 5) rather than the default (5, 3, 3). These settings slow down the indicator further and provides (in my opinion) more reliable signals. In an uptrend, we want to take any Slow Stochastic buy signal that occurs in oversold territory, below 20. (In a downtrend, we want to take any Slow Stochastic sell signal that occurs in overbought territory, above 80.)
The image below shows a great buy entry on the GBPUSD where price was trending upward, pulled back resulting in an oversold Slow Stochastic reading, and then had a Slow Stochastic signal to buy in the direction of the upward trend.
Uptrend with Slow Stochastic Entry – GBPUSD Daily Chart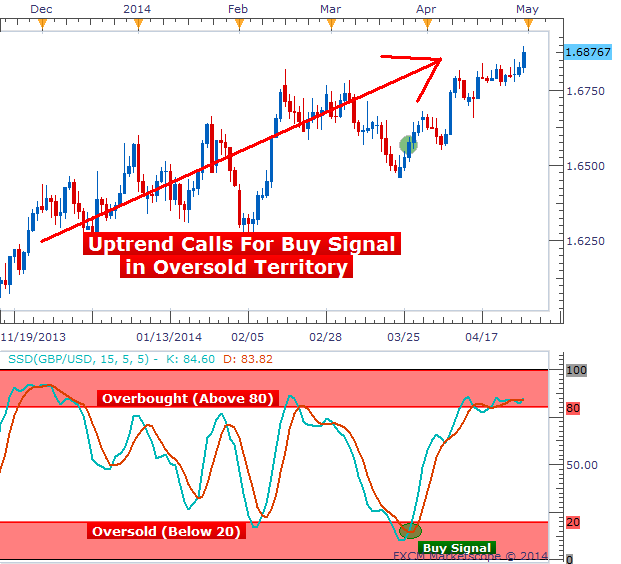
The image above shows the same trade we placed on the USD/CNH, but with much better results. Rather than using a traditional trailing stop that blindly moved up as price moved up, we moved our stop only when a new swing low was created. We set our stop below each new swing low as price progressed and were able to ride this monster uptrend 1500 pips before being stopped out.
It can take some time to be able to “eyeball” significant swing highs and lows and know exactly when a stop should be moved. But, there is a really handy tool that can be used to identify these levels more clearly.
Exit Strategy
No Strategy is complete without an exit strategy. For the trade example above, we will need to set our stop beyond the most recent swing low. I like to set my stop anywhere from 5-25 pips away from the low depending on the time frame and currency pair. With a trade size using sound money management rules.
For our limit, I suggest using a limit that is twice the distance as our stop. This gives us a positive risk:reward ratio of 1:2 with a breakeven win rate requirement of only 33%. So as long as we are correct on 1/3rd of our trades or more, we should at least be breakeven traders using this risk:reward ratio. Both the stop and limit used for this trade can be seen below.
Downloading & Installing the Asymmetric Fractals Indicator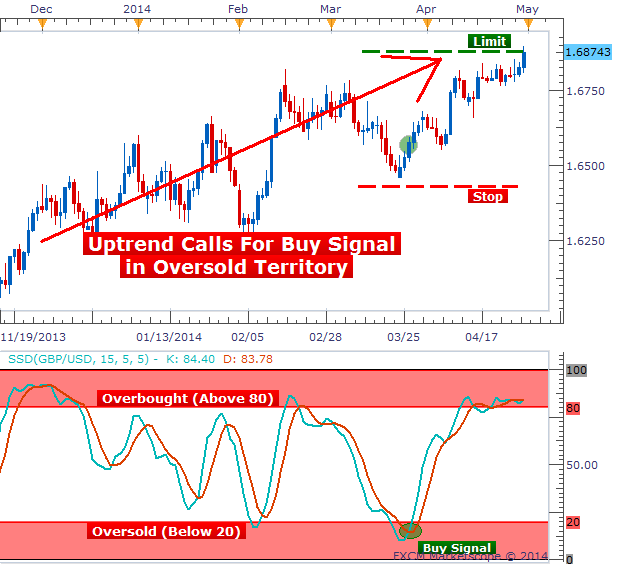
Pulverizing the Pullback
In this lesson, we discussed the importance of identifying a trend, locating pullback entries and how to manage each trade moving forward.
- Free trading apps
- Over 8,000 signals for copying
- Economic news for exploring financial markets
You agree to website policy and terms of use
HighsLowsSignal:
A semaphore signal indicator determining the moments of a directional price change on several bars, the number of bars is specified in the indicator input parameters.
Both High and Low of a candlestick series are used in the analysis.
Author: Nikolay Kositsin