Indicators: Pan PrizMA Sin leverage 72
It is interesting however I fail to see how is that any better than moving average crossovers when it comes to trading ... unless I'm missing something? :-)
Pawel Michalowski:
It is interesting however I fail to see how is that any better than moving average crossovers when it comes to trading ... unless I'm missing something? :-)
It is interesting however I fail to see how is that any better than moving average crossovers when it comes to trading ... unless I'm missing something? :-)
:-)
He is obedient.
For example, looking at SMA, I have to understand what it shows. And this indicator shows what I understand. :-)
Он послушный.
Например глядя на SMA мне приходиться понимать, что он показывает. А этот индикатор показывает, то что мне понятно. :-)
It is the most interesting indicator on this forum for me. You should try to make a cyclical indicator (with many cycles, and their sum...).
Jox90 :
For me, this is the most interesting indicator on this forum. It is worth trying to make a cyclical indicator (with a large number of cycles and their sum ...).
For me, this is the most interesting indicator on this forum. It is worth trying to make a cyclical indicator (with a large number of cycles and their sum ...).
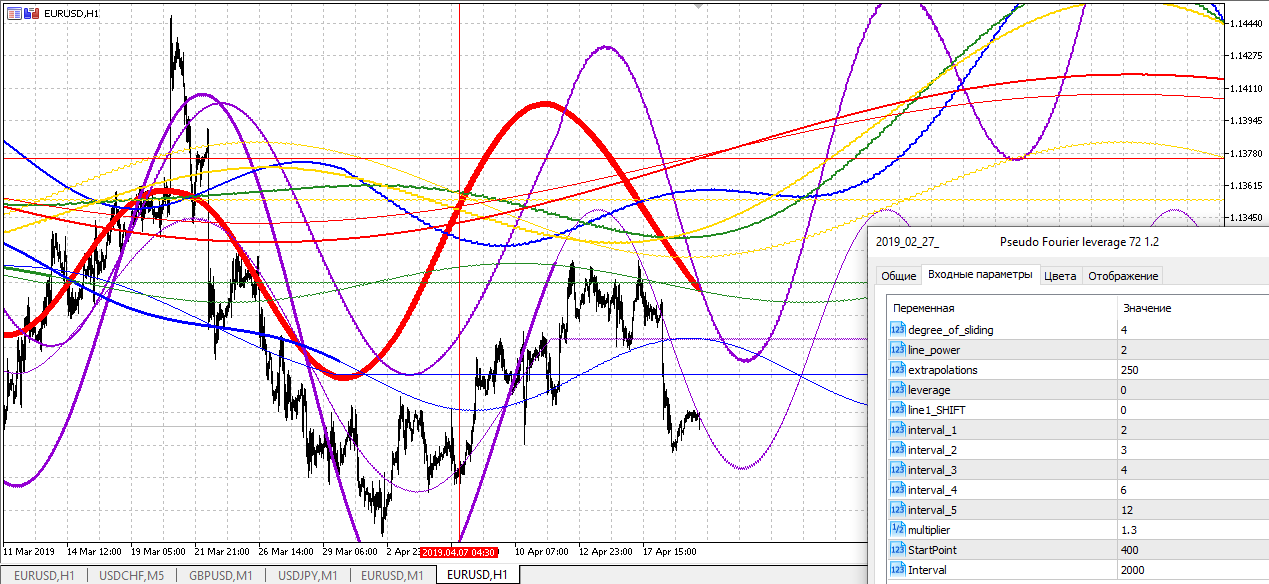
Like this?
The wide red line is final, it does not redraw.
Aleksey Panfilov:
Like this?
The wide red line is final, it does not redraw.
Wohoho...awesome! I will probably reproduce it. We all should really thank you for this indicator Aleksey. :-)
I also have a question: how do you deduct the polynomial equation coefficients used?
Jox90:
I also have a question: how do you deduct the polynomial equation coefficients used?
I also have a question: how do you deduct the polynomial equation coefficients used?
Like these:
a2_Buffer[i]=((open[i])+5061600*a2_Buffer[i+1*interval]-7489800*a2_Buffer[i+2*interval]+4926624*a2_Buffer[i+3*interval]-1215450*a2_Buffer[i+4*interval ])/1282975;
I know that Excel shows that coefficients when you create a polynomial curve. Is that your method?
Jox90:
У меня также есть вопрос: как вычесть используемые коэффициенты полиномиального уравнения?
У меня также есть вопрос: как вычесть используемые коэффициенты полиномиального уравнения?
https://www.mql5.com/ru/forum/224374#comment_6321668

Разностное исчисление, примеры.
- 2018.01.10
- www.mql5.com
Предлагаю собрать в эту ветку индикаторы и эксперты на разностном исчислении, в открытом коде...
Jox90:
I know that Excel shows that coefficients when you create a polynomial curve. Is that your method?
I know that Excel shows that coefficients when you create a polynomial curve. Is that your method?
I may be wrong, but Excel shows different coefficients .
Могу ошибаться, но Excel показывает другие коэффициенты .

Pan PrizMA Sin leverage 72:
Building a moving line by a polynomial of the 4th degree. Extrapolate a sine curve and its axis. One value on each bar is removed from the drawn lines and a sliding line of extrapolated values is drawn, which is not redrawn.
Author: Aleksey Panfilov