- Python with mql
- Best Systems GANN HiLo Activator MT4
- Which is your most profitable indicator in your forex trading?
Episode 64: Moving Average Envelopes: Simple But Effective Trend Indicators!
newdigital, 2013.11.29 06:48
Moving Average Envelopes (based on onlinetradingconcepts article)Moving Average Envelopes consist of a moving average plus and minus a certain user defined percentage deviation. Moving Average Envelopes serve as an indicator of overbought or oversold conditions, visual representations of price trend, and an indicator of price breakouts. The inputs of the Moving Average Envelopes indicator is shared below:
- Moving Average: A simple moving average of both the highs and the lows. (generally 20-period, but varies among technical analysts; also, a person could use only the close when calculating the moving average, rather than two)
- Upper Band: The moving average of the highs plus a user defined percentage increase (usually between 1 & 10%).
- Lower Band: The moving average of the lows minus a user defined percentage (again, usually between 1 & 10%).
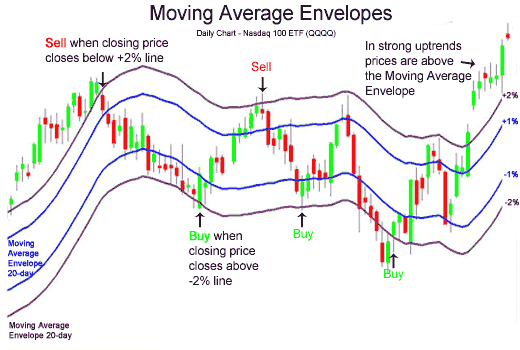
A chart of the Nasdaq 100 ETF (QQQQ) shows a 20-day moving average with both a 1% and 2% percentage bands:

In the chart above of the QQQQ's, the price is not trending. During non-trending phases of markets, Moving Average Envelopes make great overbought and oversold indicators.
- Buy when the stock price penetrates the lower envelope and closes back inside the envelope.
- Sell when the stock price penetrates the upper envelope and then closes back down inside the envelope.
When stock prices are done resting and consolidating, they breakout, in one direction or the other.
- When prices break above the upper envelope, then buy.
- When prices break below the lower envelope, then sell.
An illustration of an upward price breakout is shown above on the chart of the QQQQ's. On the right side, the QQQQ's gapped up above the 2% price band.
Price Trend IndicatorA new trend in price is usually indicated by a price breakout as outlined above with a continued price close above the upper band, for an upward price trend. A continued price close below the lower band would indicate a new downward price trend.
In the chart of the QQQQ's, after the price breakeout, the closing price continued to close above the upper band; this is a good example of how a price trend begins. Soon after, the price will fall back into the Moving Average Envelopes, but the Moving Average Envelopes will be heading in a positive direction - easily identifying the trend as up.
Moving Average Envelopes is a helpful technical analysis tool for identifying trends and trend breakouts and identifying overbought and oversold conditions. Other similar indicators such as Bollinger Bands and Keltner Channels that adjust to volatility should be investigated as well.
Good article was published -
----------------
Learn how to design a trading system by Envelopes 
In my previous article, I wrote about one of the most popular indicators — Bollinger Bands — which allows us to trade bands. This article is available at the following link: Learn how to design a trading system by Bollinger Bands
As I mentioned in this article about the Bollinger Band, the concept of band trading has a variety of existing methods that we can use. Every method has a different approach as per its calculation and its strategy but the common thing is the concept that we trade the bands.
Now, I will share another method withing the concept of band trading — the Envelopes indicator. The indicator is represented by two bands which surround the price and its moving average. In this article, we will consider some more details, including the following topics:

- www.mql5.com
Indicators are neither profitable or unprofitable. They are tools. It is what you do with their information and how you handle your entry and exit signals and manage trades that contributes to profitability. This is valid for ALL indicator. No indicator is better or worse than another. You simply select the most appropriate one for how you plan to trade, and there are many, many ways to trade.
Forum on trading, automated trading systems and testing trading strategies
All about MQL5 Wizard : create robots without programming.
Sergey Golubev, 2025.05.10 07:13

- Free trading apps
- Over 8,000 signals for copying
- Economic news for exploring financial markets
You agree to website policy and terms of use