Are this EA results reliable?
Not sure what spread you used when back-testing but try 3pts and 5pts to see if it works
The spread was 1.7 pips for the whole test. What pts stands for?:)
pts = Points and by that I'm meaning pips
If it works well with 3.0 pips and 5.0 pips you could try setting the EA up against a demo account for a few months to see how it reacts/works
The spread was 1.7 pips for the whole test. What pts stands for?:)
If your broker announced a floating spread at 15 pts (most often) , target 16 to 20 pts while backtesting.
You have many mismatched charts errors. Work to improve historical data so that there are no mismatched charts errors.
Also, you need to confirm the EA is profitable for different periods of time. Try from 2004 to 2015
Do not use variable lot sizes. Always use fixed lots because above 5 lots is not realistic and slippage will most likely happen in live account
Thanks for your replies. Here i run it again from the start of 2013. It run with 5 pips spread which is the worse it can get i guess for eur/usd
Bars in test 2058
You have many mismatched charts errors. Work to improve historical data so that there are no mismatched charts errors.
Also, you need to confirm the EA is profitable for different periods of time. Try from 2004 to 2015
Do not use variable lot sizes. Always use fixed lots because above 5 lots is not realistic and slippage will most likely happen in live account
Indeed.
Thanks for your replies. Here i run it again from the start of 2013. It run with 5 pips spread which is the worse it can get i guess for eur/usd
Bars in test 2058
I did mind only the spread value, but @Fernando Morales is true : data quality first, download clean data for sure you won't get the same results
You have many mismatched charts errors. Work to improve historical data so that there are no mismatched charts errors.
Also, you need to confirm the EA is profitable for different periods of time. Try from 2004 to 2015
Do not use variable lot sizes. Always use fixed lots because above 5 lots is not realistic and slippage will most likely happen in live account
Hello Fernando. I will search about improving history thanks. Problem is that to run from 2004 i need the ADR of each year because i base the SL and TP values on that. The 5 year test i just posted is based on last years ADR.
The lot sizes are fixed to 0.1 for all trades.
Could you suggest as to where i can access good historical data?
google TickStory
- Free trading apps
- Over 8,000 signals for copying
- Economic news for exploring financial markets
You agree to website policy and terms of use
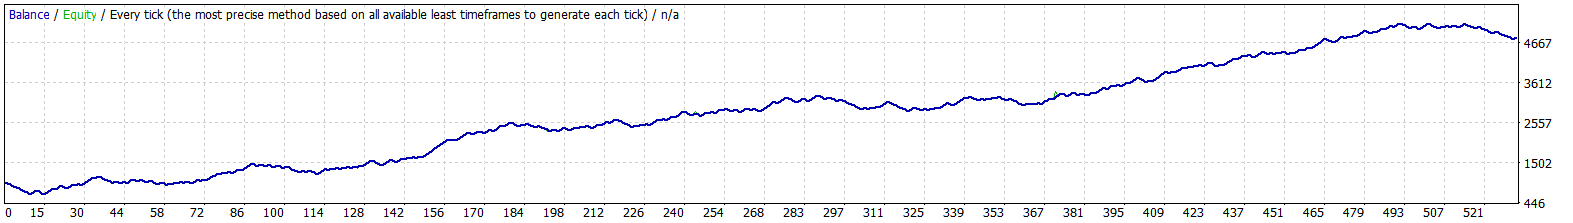
Hello, i have developed this EA that is working on daily charts, i just put my price action concept on EA. I am experienced in trading but Newbie in backtesting. I would like some insight before i put this working. Are there are any other parameters i should investigate? The results are from the January of 2016 - Present time.
Thanks!
Bars in test 1767
Ticks modelled 74519238
Modelling quality n/a
Mismatched charts errors 3589
Initial deposit 1000.00
Spread Current (16)
Total net profit 3584.43
Gross profit 11008.90
Gross loss -7424.47
Profit factor 1.48
Expected payoff 7.63
Absolute drawdown 1.70
Maximal drawdown 391.21 (18.87%)
Relative drawdown 18.87% (391.21)
Total trades 470
Short positions (won %) 248 (36.29%)
Long positions (won %) 222 (42.34%)
Profit trades (% of total) 184 (39.15%)
Loss trades (% of total) 286 (60.85%)
Largest
profit trade 62.38
loss trade -31.11
Average
profit trade 59.83
loss trade -25.96
Maximum
consecutive wins (profit in money) 6 (358.02)
consecutive losses (loss in money) 11 (-283.14)
Maximal
consecutive profit (count of wins) 358.02 (6)
consecutive loss (count of losses) -283.14 (11)
Average
consecutive wins 2
consecutive losses 2