Is it possible to see multiple symbol tabs using indicator?
Can someone please help me with my queries?
It's only possible with an Expert.
#define count_symbol 3
string Symbols[count_symbol]={"CADCHF","GBPAUD","EURUSD"};
long chart_id[count_symbol];
int handle[count_symbol];
double Buffer1[];
double Buffer2[];
double Buffer3[];
input int Fetch_Candles=1000;
input bool CallMyProgram=true;
input bool writedata=true;
input bool draw_charts = true;
input bool showbuffer1 = true,showbuffer2 = false;
//+------------------------------------------------------------------+
//|                                                                  |
//+------------------------------------------------------------------+
int OnInit()
  {
//---
   for(int i=0; i<count_symbol; i++)
     {

      SymbolSelect(Symbols[i],true);
      //if((chart_id[i]=ChartOpen(Symbols[i],0))==-1)
      //   Print(chart_id[i]," ",_LastError);

      if((handle[i]=iCustom(Symbols[i],0,"Real Time Testing\\Trade_Real_Test",0,false,false,false);
         return(INIT_SUCCEEDED);

      if(!ChartApplyTemplate(0,"template.tpl"))
         Print(_LastError);
     }
//---
   return(INIT_SUCCEEDED);
  }
//+------------------------------------------------------------------+
//| Expert deinitialization function                                 |
//+------------------------------------------------------------------+
void OnDeinit(const int reason)
  {
//---

  }
//+------------------------------------------------------------------+
//| Expert tick function                                             |
//+------------------------------------------------------------------+
void OnTick()
  {
//---
   CopyBuffer(handle[0],0,0,1,Buffer1);
   CopyBuffer(handle[1],0,0,1,Buffer2);
   CopyBuffer(handle[2],0,0,1,Buffer3);
  }
//+------------------------------------------------------------------+
It's only possible with an Expert.
It shows overlap values to me when I am testing it. The Object Label I have used to display values. Bit of troublesome for me. Even the template is not getting applied in the testing mode.
It's only possible with an Expert.
See the two images in my Strategy Tester. Please tell me what mistake I made as I am a bit unclear about it.
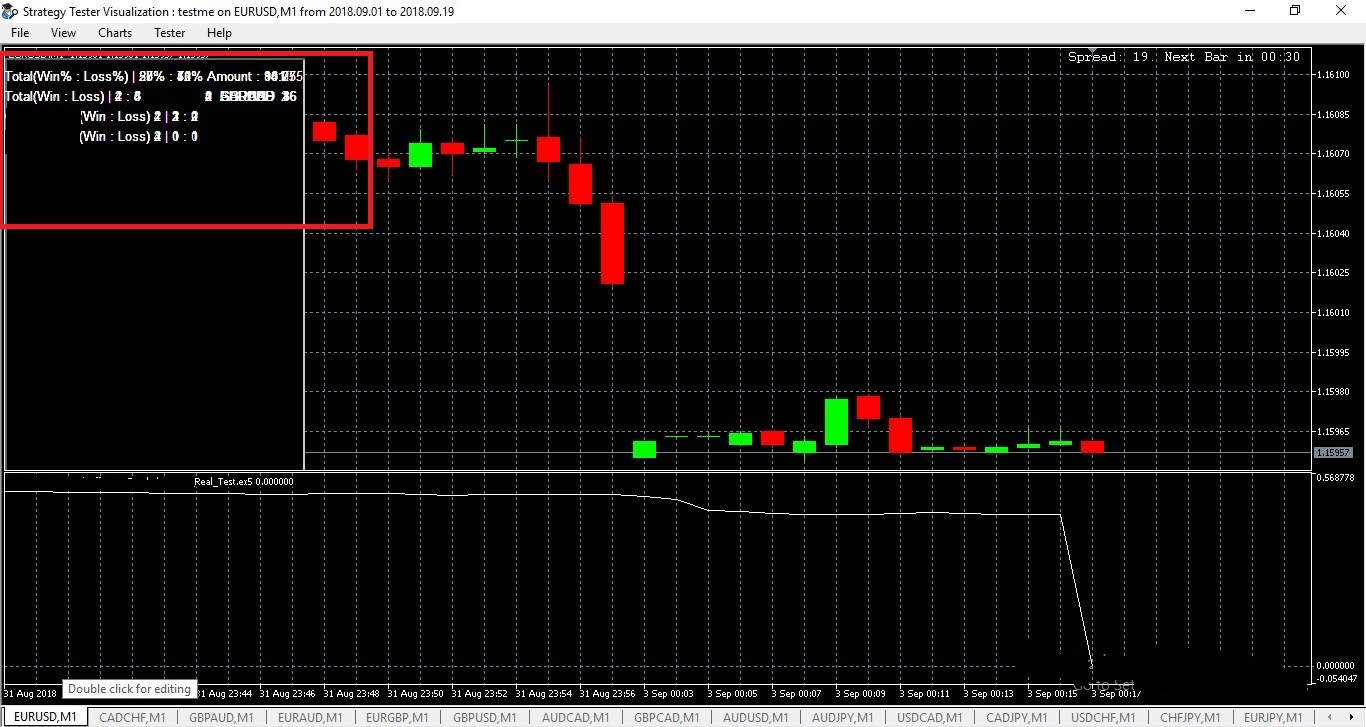
The above image shows the objects in place but contains it contains information related to all the symbols and not the respective symbol alone.
See the following image where the indicator is applied but the values or object are not shown:

Kindly, let me know what I can do please.
See the two images in my Strategy Tester. Please tell me what mistake I made as I am a bit unclear about it.
The above image shows the objects in place but contains it contains information related to all the symbols and not the respective symbol alone.
See the following image where the indicator is applied but the values or object are not shown:
Kindly, let me know what I can do please.
All charts have the same ID, so objects will only appear on the main one.
All charts have the same ID, so objects will only appear on the main one.
Is there no way to separate out the IDs of the chart so that the objects appear n different graphs? Or is there a way I can show it separately on the same chart? Can you guide me sir?
- Free trading apps
- Over 8,000 signals for copying
- Economic news for exploring financial markets
You agree to website policy and terms of use
I have seen this expert and while I am testing I can see that it generates multiple tabs of different symbols with different timeframes. https://www.mql5.com/en/articles/770
While testing I see the following image.:
As you see there are mutipe tabs of different currency pair and the timeframe.
I want to know how I can achieve this using the indicator. Is it feasible to show different symbols with same indicator whie testing through Strategy Tester as in the expert it does.
Please anybody shade light and help me.