Discussion of article "Visualizing optimization results using a selected criterion"
My question is related to optimisation, but not related to this particular article. So first of all, I apologise for putting this question in this thread.
Is there any way to start optimising MQL5 code to run the optimiser?
I mean, is there any way to just start the optimiser from the MQL5 code and click "Start" with a specified start date.
I would be very grateful if you can answer this question. Since I noticed that you have put some articles on optimisation and hence, I think you can provide some solution to this optimisation problem.
You can also just drag and drop the image into the text or paste it with Ctrl + V
Check out the article LifeHack for the trader: one backtest is good, but four is better
Missing header file
#include <EasyAndFastGUI\WndEvents.mqh>
#include <EasyAndFastGUI\TimeCounter.mqh>
Missing file 。。。。。
Hi,
Is these files still working?
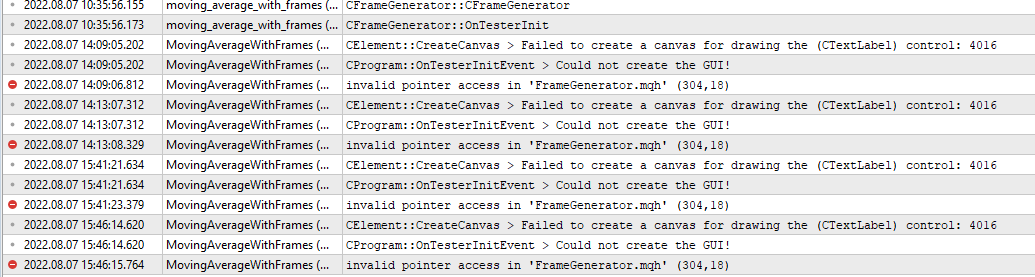
I'm trying to install it, but it's not working.
There is a lot of warning message:
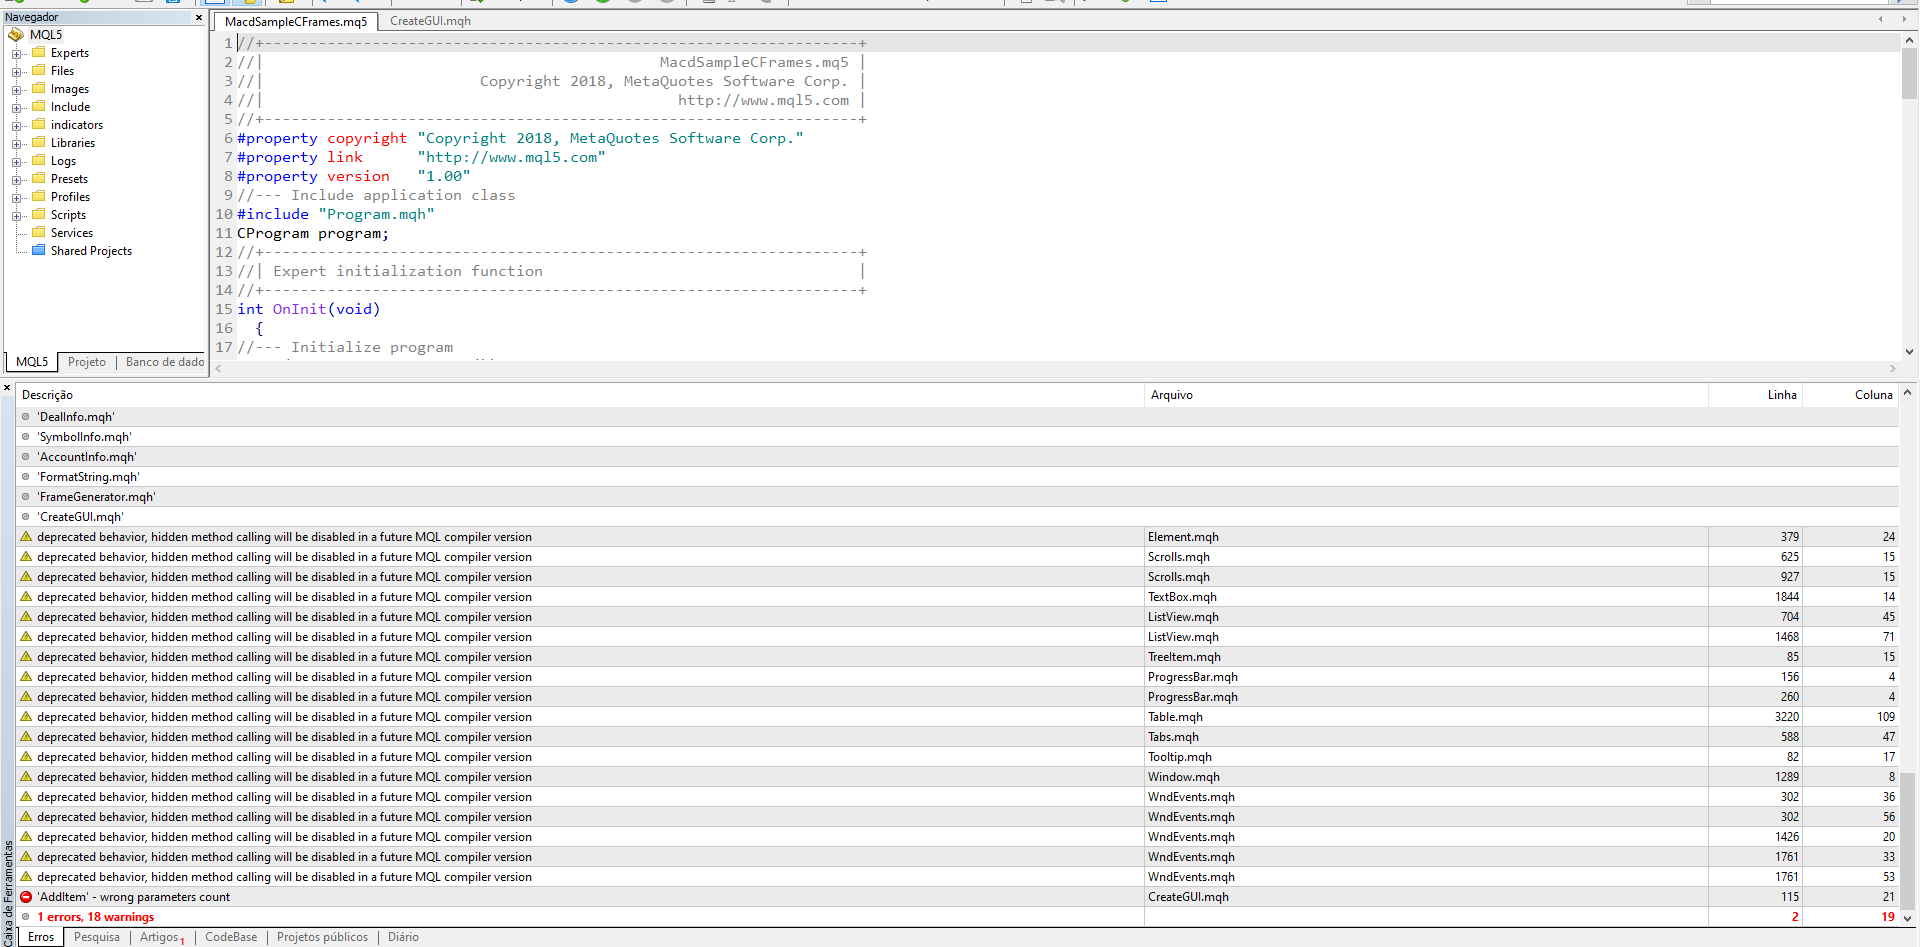
And there is 1 error message:
![]()
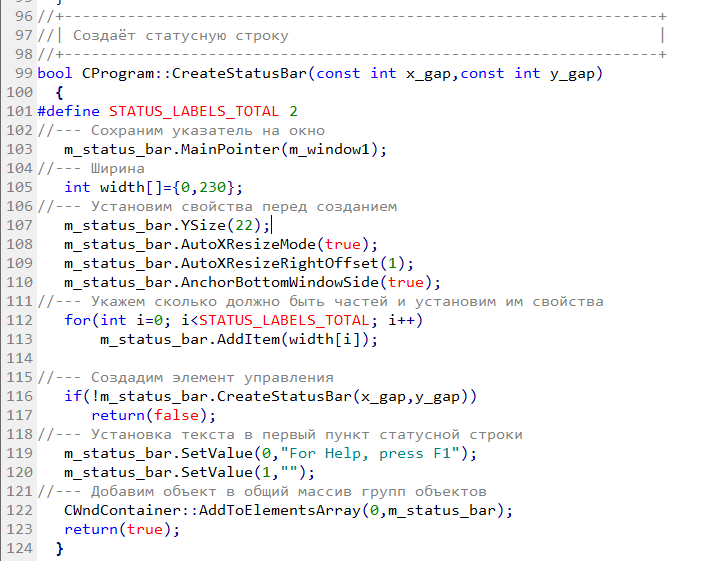
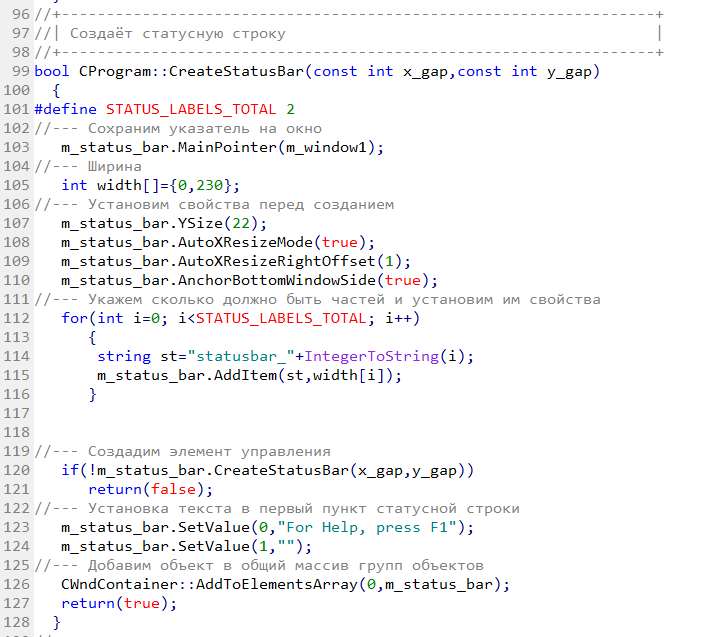
For the Error - "AddItem" in CreateGui.mqh file, I solved inserting some string routine in the function:
//--- Specify the number of parts and set their properties
   for(int i=0; i<STATUS_LABELS_TOTAL; i++)
      {
       string status_add="status_bar_"+IntegerToString(i); // Line insterted to fix the error.
       m_status_bar.AddItem(status_add,width[i]);
      }
But, when I try to used it, the panel still in blank. There is no information.
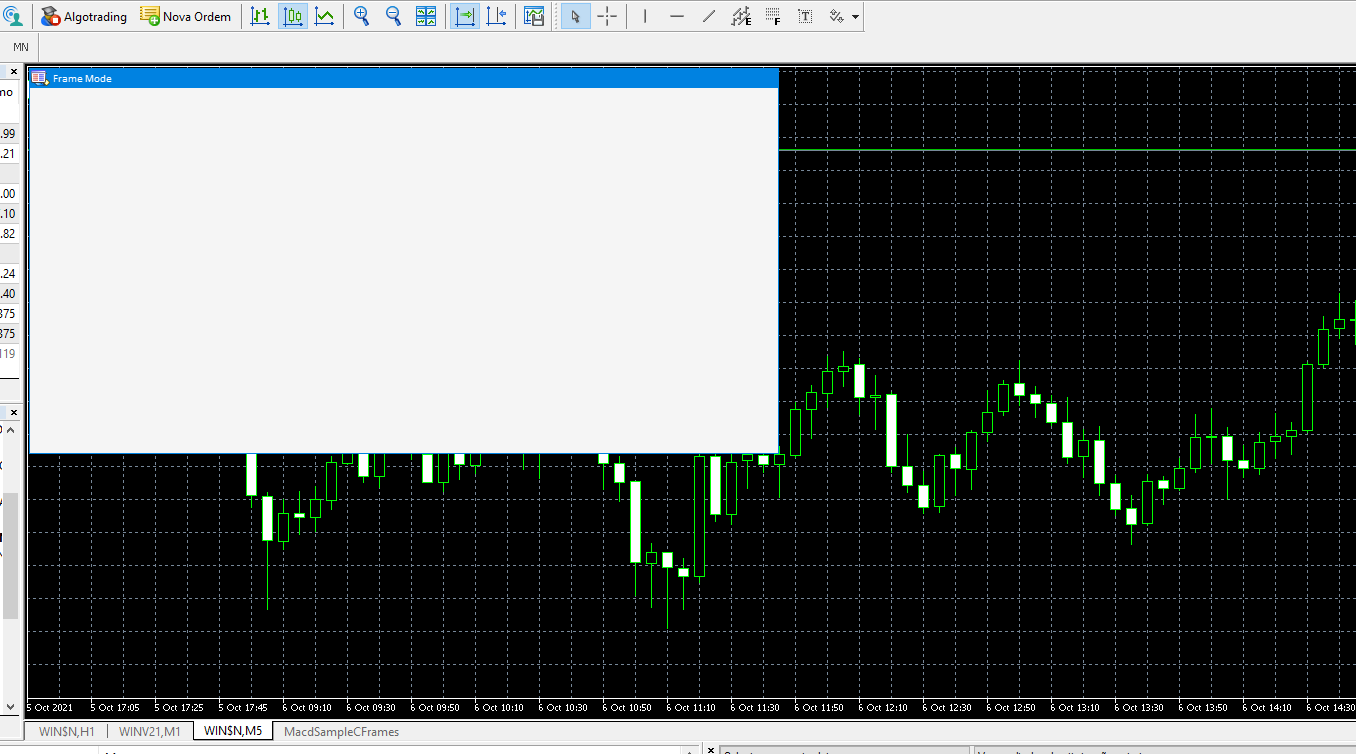
Please @Anatoli Kazharski , could you help me? Please.
Hi,
First of all, thank you very much for sharing your code. It has been very helpful. You have done a good job.
The problem was solved by installing on a fresh new MT5.
But the files from the last article did not work, even installed in other MT5 - https://www.mql5.com/en/articles/4395
Another problem I encountered is related to "AddItem".

It seems that the new version of EasyAndFastGui changed the way AddItem works. So it was decided to insert a procedure to create a "string".
Before:
After:
Update the files if possible.

- www.mql5.com
New article Visualisation of optimisation results by selected criteria has been published:
Author: Anatoli Kazharski
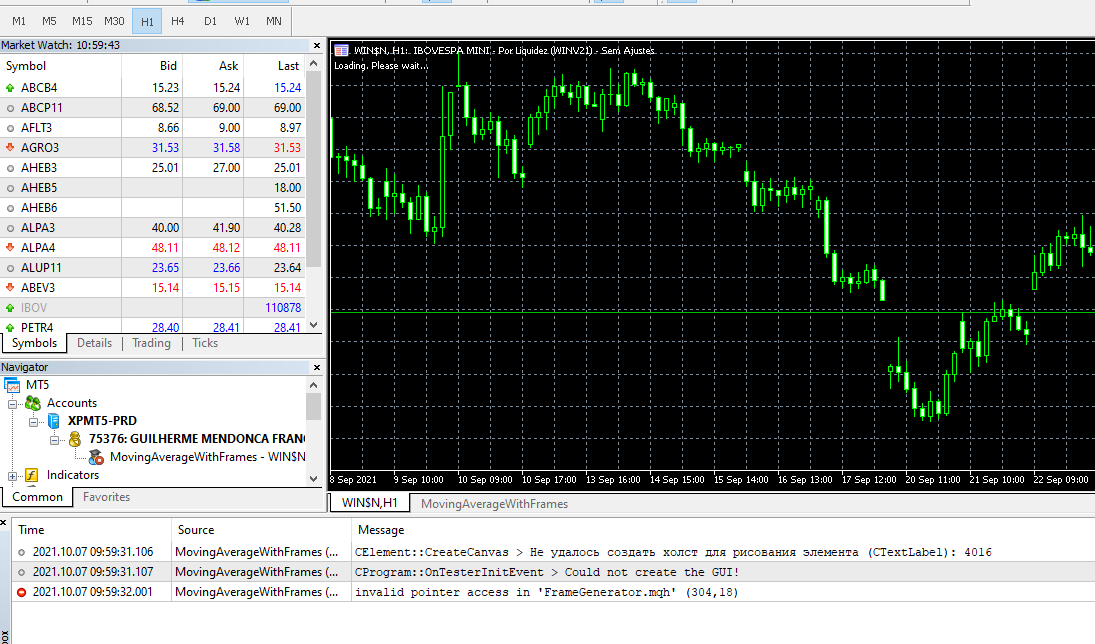
i am getting this error what could it be.
- Free trading apps
- Over 8,000 signals for copying
- Economic news for exploring financial markets
You agree to website policy and terms of use
New article Visualizing optimization results using a selected criterion has been published:
In the article, we continue to develop the MQL application for working with optimization results. This time, we will show how to form the table of the best results after optimizing the parameters by specifying another criterion via the graphical interface.
To see the visualization of all selected results, go to the Results tab and then select the Favorites tab. By default, 100 best results by the Profit criterion are added to the table. Another criterion for selecting 100 best results can be selected from the Criterion drop-down list at any moment. We will return to this later. Now let's consider the methods of organizing this process.
Fig. 2. Graph of the best optimization results
Author: Anatoli Kazharski