Display Speed in the Chart Area
What are you talking about ? There is no "graph" in the Data Window.
Good afternoon Alain,
Really, there are no graphics inData window, I so sorry for writting the wrong
name of the area where the candlesticks are plotted. (I'll be reissuing the above question to not replicate errors)
My question refers to the candles that are plotted on the chart. In times of high volatility and high volume, the candles suffer a delay in plotting, it seems that the MT5 is catching.
Richardson
That's not normal. Do you have indicator(s) on your chart ?
Can you post a screenshot ?
Alain,
I use timeframe of M1, the indicators I use are moving averages, Bollinger bands and OBV. The indicators always follow formation of the candles, they are OK. What I do not consider normal, is that at some moments, the formation of the candle delay, and I've seen a 4 minute draw in the graph with respect to the clock of my computer. In normal condition, the clock of my computer is equal to the formation of the candle in the graph, that is, in the change of the minute in the computer, the graph begins to plot a new candle.

This problem does not just happen to me. I have a group of traders in whatsapp where other people report this same problem.
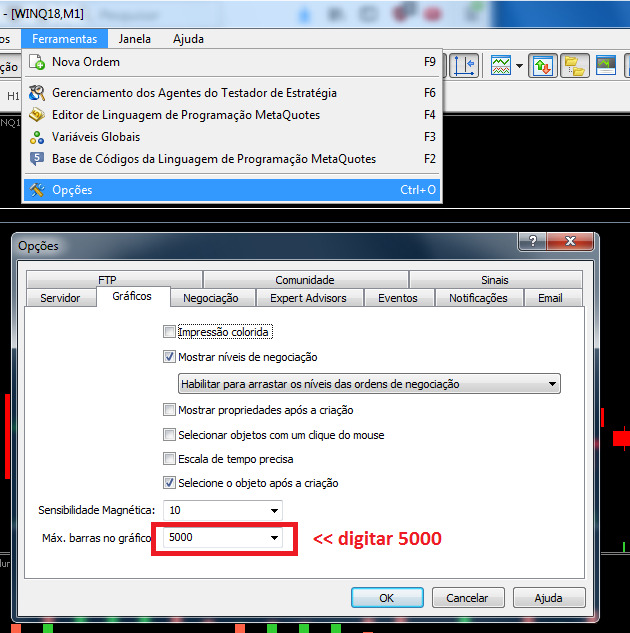
There is a change that we made but did not solve the problem and left the graph slightly lighter, it was to change the maximum number of bars plotted in the graph, as shown below (it's in Portuguese):
Thank you in advance for the answers.
Richardson
Alain,
I use timeframe of M1, the indicators I use are moving averages, Bollinger bands and OBV. The indicators always follow formation of the candles, they are OK. What I do not consider normal, is that at some moments, the formation of the candle delay, and I've seen a 4 minute draw in the graph with respect to the clock of my computer. In normal condition, the clock of my computer is equal to the formation of the candle in the graph, that is, in the change of the minute in the computer, the graph begins to plot a new candle.
MT5 chart doesn't draw a candle if there is no tick, could it be what you have seen ?
Your screenshot shows nothing..."I have seen a 4 minute draw..." What that means exactly ?
- Free trading apps
- Over 8,000 signals for copying
- Economic news for exploring financial markets
You agree to website policy and terms of use
Would like to know if you can speed up or change how often the graph appears in the Chart Area.
I did some tests and realized that when there is an increase in the tick volume, the graph starts to crash and Terminal64.exe starts consuming a lot of processing (around 50%, noted in Windows TaskManager). This locking can leave the graphic static for up to a few minutes. In these cases, if you simply minimize the MT5 for a few seconds and maximize it, I realize that the processing decreases and the chart is already plotted correctly.
I know there is no defaut setting that can fix this, and I have not found any specific topics about it either. So I ask, is it possible to do some mql treatment that can solve this? Are there libraries ous codes dedicated to frequently updating graphics or
anything around this theme?
Richardson