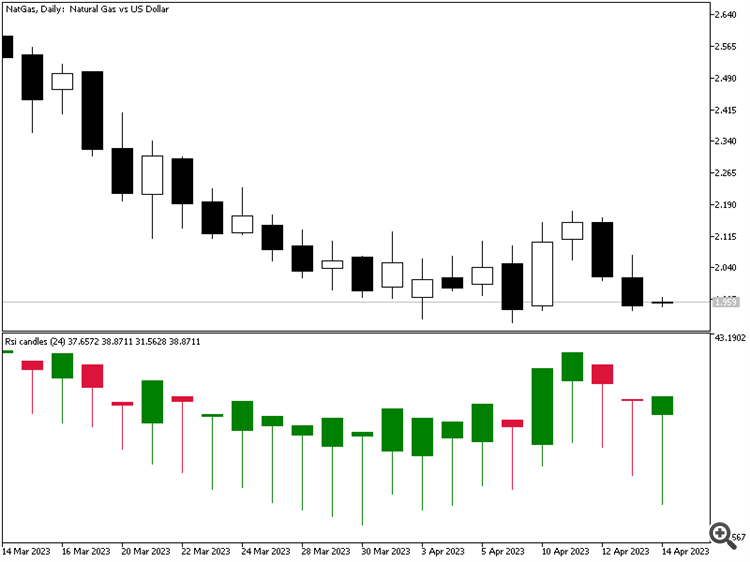
Can you explain how the current RSI candle is larger than the previous one even though the daily candle has just opened and has almost no range compared to previous one?
According to you, when a new RSI candle is formed, it has to be all zeroes? And, implicitly, the new RSI (any RSI) should be 0 or, at least, exactly the same (for all 4 prices used for 4 rsi calculations)?
Those candles are not PRICE candles. Those are RSI candles calculated from 4 different RSIs. I suggest you check the code, how the candles are calculated and the way how RSI itself is calculated - that shall clarify all.
______________________
PS: original RSI (that is used in the rsi candles indicator) is a momentum type of indicator. As a momentum type of indicator it is not advised to use long periods (like that period 24). Not even the inventor of RSI, Welles Wilder, recommends using long periods for RSI
No, I do not believe the new RSI candle should be all zeros. I expressed my doubt badly. I am asking how the high and low of the RSI candle is calculated, whereby the range of the current RSI candle can be so much greater than both those of the previous RSI candle and the current price candle for the same period.
According to you, when a new RSI candle is formed, it has to be all zeroes? And, implicitly, the new RSI (any RSI) should be 0 or, at least, exactly the same (for all 4 prices used for 4 rsi calculations)?
Those candles are not PRICE candles. Those are RSI candles calculated from 4 different RSIs. I suggest you check the code, how the candles are calculated and the way how RSI itself is calculated - that shall clarify all.
______________________
PS: original RSI (that is used in the rsi candles indicator) is a momentum type of indicator. As a momentum type of indicator it is not advised to use long periods (like that period 24). Not even the inventor of RSI, Welles Wilder, recommends using long periods for RSI
PS: the 24 period RSI is working amazingly well for me. The original concept was for a 7/10/14 day period RSI (still as arbitrary as any other period). I like to use the 24 period on the H1 charts in combination with D1 candle formations. The momentum of the last 24 hours can offer great insights into the potential daily bias. Any tool will evolve from the early concepts and ideas of its origins and can be adapted to many scenarios.
- Free trading apps
- Over 8,000 signals for copying
- Economic news for exploring financial markets
You agree to website policy and terms of use

RSI Candles:
One possible way of normalizing prices into a known bound.
This is a RSI of High, Low, Open and Close displayed as color candles in it's own sub-window. The interesting is that the prices are reflected in a very close manner to a known 0 to 100 range and that opens a lot of new possibilities.
Author: Mladen Rakic