anyone can explain the alligator indicator?
Forum on trading, automated trading systems and testing trading strategies
newdigital, 2013.10.03 16:25
Alligator Indicator Technical Indicator
Developed by Bill Williams
Alligator Technical Indicator is a combination of three Moving Average Lines that use fractal geometry and nonlinear calculation.
The three smoothed moving averages are:
- The green line (Alligator’s Lips) 5-period Smoothed Moving Average, with a shift of 3 bars into the future.
- The red line (Alligator’s Teeth) 8-period Smoothed Moving Average, with a shift of 5 bars into the future.
- The blue line (Alligator’s Jaw) 13-period Smoothed Moving Average, with a shift of 8 bars into the future.
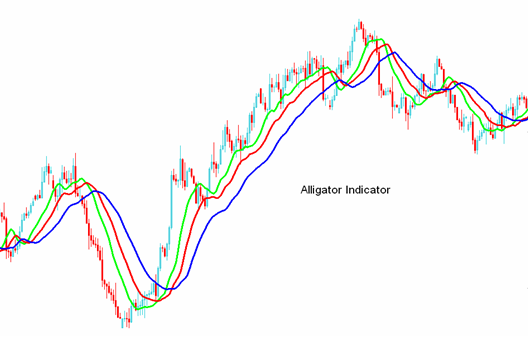
Lips, Teeth and Jaw of the Alligator show the interaction of different time periods.
When the Jaw, the Teeth and the Lips are closed or intertwined, it means the Alligator is going to sleep or is asleep already. As it sleeps, it gets hungrier and hungrier — the longer it will sleep, the hungrier it will wake up. The first thing it does after it wakes up is to open its mouth and yawn. Then the smell of food comes to its nostrils: flesh of a bull or flesh of a bear, and the Alligator starts to hunt it. Having eaten enough to feel quite full, the Alligator starts to lose the interest to the food/price (Balance Lines join together) — this is the time to take the profit.
Forum on trading, automated trading systems and testing trading strategies
newdigital, 2013.10.03 16:36
The Alligator Indicatorby Alexander Sabodin
==========
There is a moving average-based trading system that I have found works best in trending markets, with its main instrument the alligator indicator. The alligator was first described by Bill Williams in his book New Trading Dimensions. Some software packages include the alligator indicator, but if it's not available, all you have to do is take three smoothed moving averages using 13, eight, and five periods and shift them by eight, five, and three bars into the future. The longest period line is blue (the alligator's jaw), the middle one is red (the alligator's teeth), and the shortest one is green (the alligator's lips).
According to Williams, when these three moving averages are twisted together, it means the alligator indicator rests, and so we also rest. But the longer the alligator sleeps, the hungrier it is. So when the alligator awakes after a good, long rest it is very hungry to hunt for food. And its food is price.
Your challenge is to keep company with this animal and hunt with it;
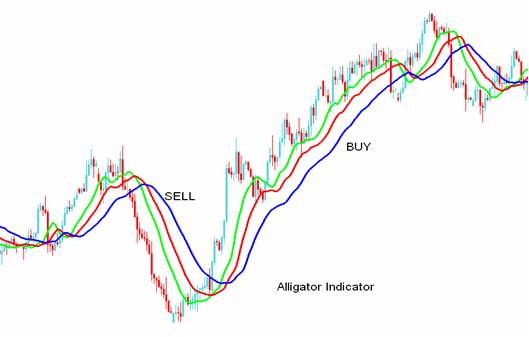
otherwise, you yourself risk being eaten. When all three lines are aligned,
going up one after another with the green being greater than red being
greater than blue, prices are in an uptrend. You need to look into the
possibility of buying. In the event they move down, with the green being
less than the red being less than blue, then you'll be looking into the
possibility of selling since it indicates a downtrend. If moving averages
are entwined, then it is best to be out of the market (Figure 1).
FIGURE 1: THE ALLIGATOR. When the alligator is sleeping, it's best to stay out of the market. When it wakes up is when you should tackle the market with it.
THE TRADING SYSTEM
1. D1 time frame indicates the direction of signals. With the naked eye you can see that prices do not move in a straight line but rather in peaks and troughs. In other words, trends move in waves.
Charles Henry Dow in his Dow theory identified three trend categories: primary, secondary, and minor. The primary tendency is similar to the flow. The secondary resembles waves that constitute flow. The minor trends look like ripples.
The trend is presented in the D1 (daily) time frame as a flow. This means that your aim is to find a wave inside the flow that is moving in a different direction in order to identify a useful entry point. And because of this we use the H4 time frame. At this scale you are waiting for the alligator moving against the day signal.
2. If D1 is in an uptrend, then you need to wait for the downtrend on H4 (four hours). If D1 is in a downtrend, then you must wait for the uptrend on H4. You need to wait for a good entry along the trend (Figure 2). For this reason we use the M30 (30-minute) time frame. Suppose that on the daily chart the alligator looks upward. The next step is to wait for the downward wave on H4. And when the alligator gives a buy signal, after the moving averages cross over and are trending higher, you would enter a long position. The trade system has finished configuration:
FIGURE 2: WAITING FOR A GOOD ENTRY. If D1 is in an uptrend, then you need to wait for the downtrend on H4 (four hours). If D1 is in a downtrend, then you would wait for the uptrend on H4.
During the buy or sell signal setup, you are waiting for a precise and
reliable moving average crossover. Now you could look at the closing price
of the candle. If there is a crossover at closing time, you have a signal.
In the event the moving average crossover did not happen, you would have
to wait for the next closing price. Once you have opened a position, the
best area to place a stop-loss is over the price pivot (Figure 3).
To define the price target I tend to look at some of the more classic technical analysis. Essentially, we are looking at important resistance and support levels or we wait for a trend reversal or the start of a correction. This means a reversal price pattern or a divergence with price at oscillators. The direction and target of the signals are derived from the lag by the longest of three time frames in this trading system.
FOLLOW THE ALLIGATOR
Like all the moving averages, the alligator is a lagging indicator. Such a lag in getting a trade signal leads to a partial loss of profit. Further, this lag functions as a filter and helps eliminate insignificant and false signals.
In testing the alligator indicator, I have found that hunting hand in hand with the alligator works better than all the other moving average crossover systems I have used. The alligator trading system yielded the lowest losses in unfavorable market conditions of all the moving average crossover systems.
Forum on trading, automated trading systems and testing trading strategies
newdigital, 2013.10.03 16:44
Don't feed the Alligator when it sleeps!

Example of this one :
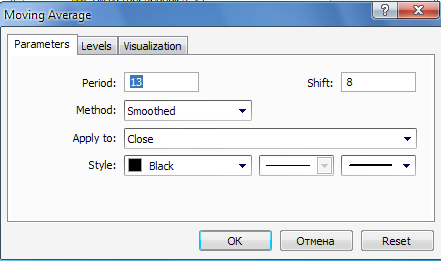
The blue line (Alligator’s Jaw) 13-period Smoothed Moving Average, with a shift of 8 bars into the future.
using MA (by settings) :
Alligator Histogram Four Colors - indicator for MetaTrader 5

- Free trading apps
- Over 8,000 signals for copying
- Economic news for exploring financial markets
You agree to website policy and terms of use
The Alligator’s Jaw, the “Blue” line, is a 13-period Smoothed Moving Average, moved into the future by 8 bars
what does it mean by `moved into the future by 8 bars'? I did not find a corresponding concept in MA definition.