What Is the Difference between These two Pairs
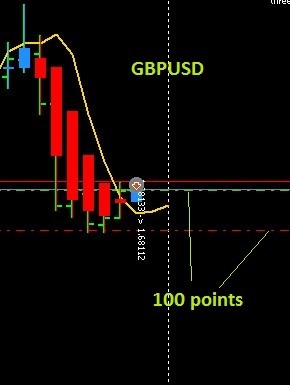
Please i need to understand why the distance between 100 points of GBPUSD is higher than the distance of 100 points of EURAUD. Its confusing. Is there something i should be aware of...?
Take a look at this snapshot
Because of the vertical scale on the right side of your chart windows.
They are not fixed (show variable values) as you can see if you scroll backwards in the timeline.
but will you say it much profitable trading EURAUD than GBPUSD?
Hi Roszey, as pointed out by blueball the difference is just the scale, that will change even for the same instrument, since horizontal scale (time) is static (if you do nothing) and vertical scale (prices) is dynamic (shows variable values).
To better understand, this is like the distance of support/resistance lines for the last P periods of the graph, as the distance between these lines change as price changes.
- Free trading apps
- Over 8,000 signals for copying
- Economic news for exploring financial markets
You agree to website policy and terms of use
Please i need to understand why the distance between 100 points of GBPUSD is higher than the distance of 100 points of EURAUD. Its confusing. Is there something i should be aware of...?
Take a look at this snapshot