Indicators: Identical candles
Hm, the Indicator doesn't seem to make sense to me at present. If the up arrows indicate a strong signal based on the larger proportion of candles within the given timeframes being completed in the same direction - why do the arrows for completed candles change drastically based on changes to the period.
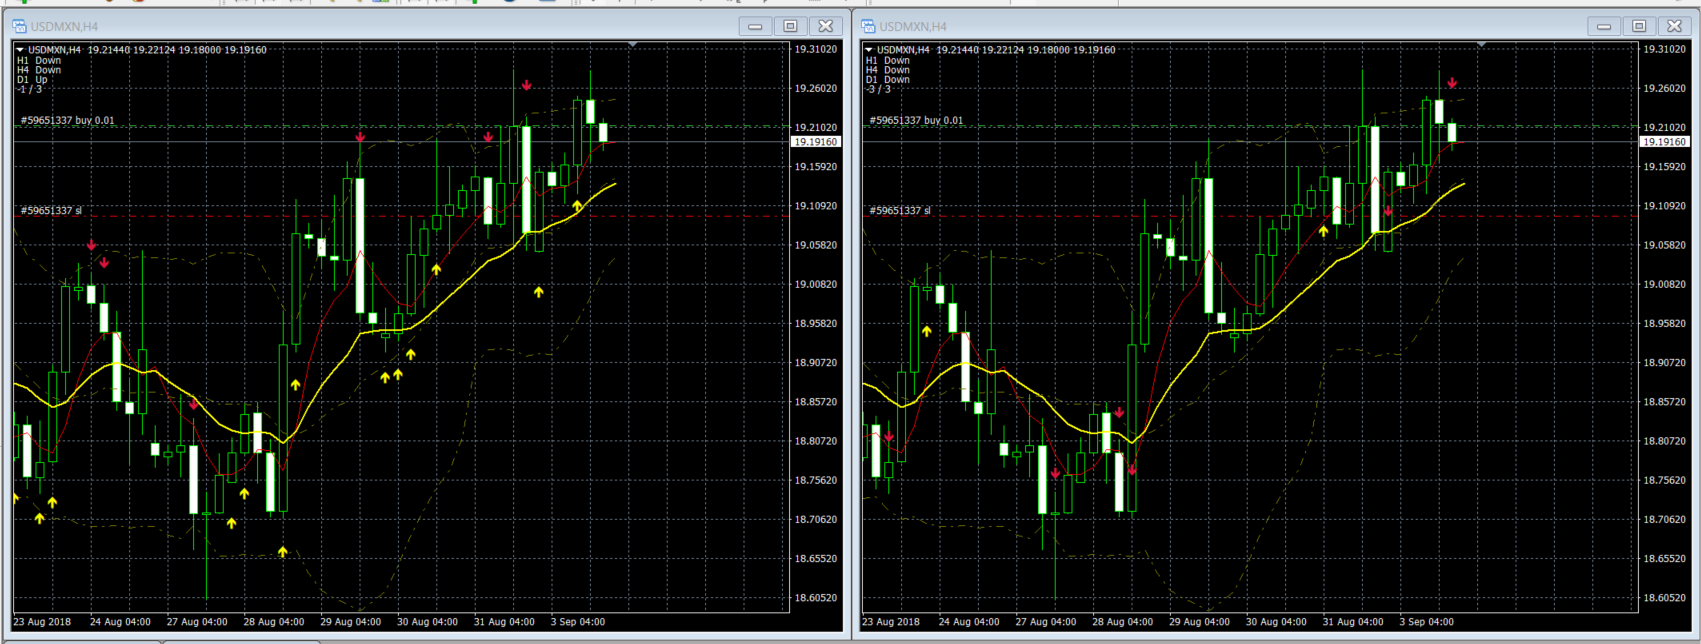
The indicator on the left and right charts below are of the same setting, the only difference is on the left chart the period is set to 0, on the right chart it is set to 1 - yet although all but the latest candle is complete, the position of the arrows are so different.
Hm, the Indicator doesn't seem to make sense to me at present. If the up arrows indicate a strong signal based on the larger proportion of candles within the given timeframes being completed in the same direction - why do the arrows for completed candles change drastically based on changes to the period.
The indicator on the left and right charts below are of the same setting, the only difference is on the left chart the period is set to 0, on the right chart it is set to 1 - yet although all but the latest candle is complete, the position of the arrows are so different.
Re-attempting attachment. Also there are times where I'd have 5 down arrows on a chart, and all of a sudden it'd change to up arrows...

- Free trading apps
- Over 8,000 signals for copying
- Economic news for exploring financial markets
You agree to website policy and terms of use
Identical candles:
This is the semaphore indicator of candles that highlights the candles on the chart, which have same direction like all candles for your chosen timeframes.
Author: Yurij Izyumov