Determine The Market Direction
The market direction depends on which type of fractal has broken last
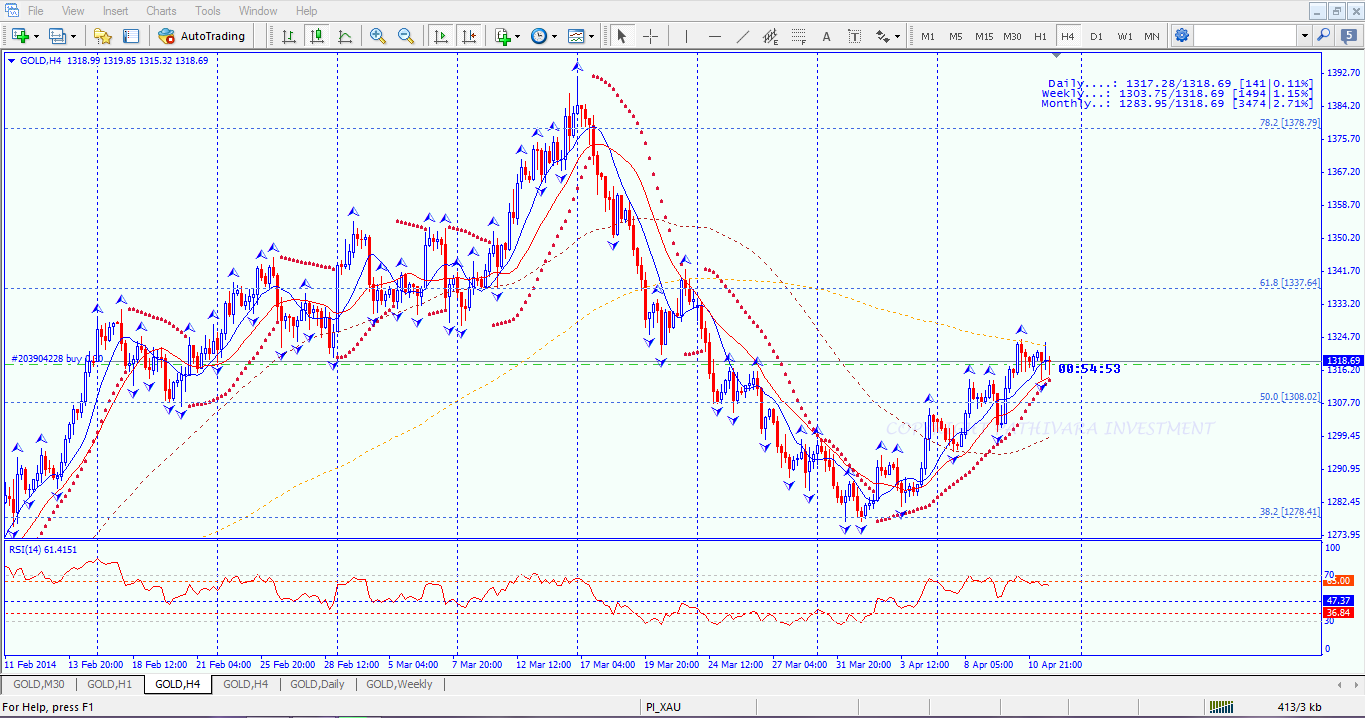
In order to determine the market direction, find the last broken up fractal and the last broken down fractal. Determine which of these two fractals broke last. If the up fractal broke last, the market direction is up. If the down fractal broke last, the market direction is down.
Note: it does not matter where the actual fractal that is broken is located, what counts is the location of the point where it breaks. It is important to understand that it is the last break of a fractal that counts to determine the market direction, and not the fractal itself. Take a look at the following chart:
Files:
md.jpg
76 kb
- Using Fractal Indicator To Determine Market Direction
- Using Fractal Indicator To Determine Market Direction
- Indicators with alerts/signal
Roszey:
It's Bill Williams way of using fractals indicator, but it's only a part of his strategy, and is not enough reliable alone. Market is not always (and almost never ?) so easy that on the chart you posted, unfortunately.
The market direction depends on which type of fractal has broken last
In order to determine the market direction, find the last broken up fractal and the last broken down fractal. Determine which of these two fractals broke last. If the up fractal broke last, the market direction is up. If the down fractal broke last, the market direction is down.
Note: it does not matter where the actual fractal that is broken is located, what counts is the location of the point where it breaks. It is important to understand that it is the last break of a fractal that counts to determine the market direction, and not the fractal itself. Take a look at the following chart:
angevoyageur:
It's Bill Williams way of using fractals indicator, but it's only a part of his strategy, and is not enough reliable alone. Market is not always (and almost never ?) so easy that on the chart you posted, unfortunately.
Absolutely right, sure can be implemented as a part of a strategy, currently I am trying to see the fractals highs and lows around considered SMA 60 and SMA 150 and figure out how the trend behaved in the past, hoping, based on which, to figure out possible trend up ahead. It sure is not that easy to figure out the market direction.It's Bill Williams way of using fractals indicator, but it's only a part of his strategy, and is not enough reliable alone. Market is not always (and almost never ?) so easy that on the chart you posted, unfortunately.
angevoyageur:
It's Bill Williams way of using fractals indicator, but it's only a part of his strategy, and is not enough reliable alone. Market is not always (and almost never ?) so easy that on the chart you posted, unfortunately.
It's Bill Williams way of using fractals indicator, but it's only a part of his strategy, and is not enough reliable alone. Market is not always (and almost never ?) so easy that on the chart you posted, unfortunately.
Indeed, by the way this indicator was introduced by Bill Williams in the suggestive book title "Trading Chaos" !! (http://www.amazon.com/Trading-Chaos-Maximize-Technical-Techniques/dp/0471463086)
In this sense, maybe instead of unfortunately we can say luckily, since chaos theory makes trading challenge an infinity complexity problem to we all address.
You are missing trading opportunities:
- Free trading apps
- Over 8,000 signals for copying
- Economic news for exploring financial markets
Registration
Log in
You agree to website policy and terms of use
If you do not have an account, please register