Ramesh Poudyal
Ramesh Poudyal
  • Research at Pathivara Investment
  • Nepal
  • 253
  • Information
7+ years
experience
0
products
0
demo versions
0
jobs
0
signals
0
subscribers
Research at Pathivara Investment
Ramesh Poudyal
Ramesh Poudyal
Update on XAUUSD.
Is XAUUSD unfolding a Bullish Butterfly Pattern ?
Theory - The XA impulse started at 1049 (X) to 1344 (A). The retracement AB is 78.6 % fib of XA at 1121.17. The BC leg is currently at play, according to the setup, the BC leg should be 38.2 % to 88.6% fib of AB, 78.6% is at 1321.82 and 88.6 % is at 1346.94. If the price gets terminated there, then the CD leg would come into play. Let's wait and see how prices unfold in coming days :) .
Ramesh Poudyal
Ramesh Poudyal
This is the Weekly Chart that I mentioned in the recent post.
Ramesh Poudyal
Ramesh Poudyal
This is an image for Daily Chart that I mentioned in the recent post.
Ramesh Poudyal
Ramesh Poudyal
Hello Traders,
I am posting this view to let my signal subscribers understand what I am thinking fo current open positions. Well, I don't have many of the subscribers (only 2) and I even don't know if the signal is being used in real or demo account. But anyway, it doesn't matter I only have 2 subscribers and I don't know if it is being used in Real account but I it is my responsibility to make them clear of what I am doing with the trades.So, here we go.
Let me attach some charts first. I am going to attach the Weekly, Daily and H4 charts of XAU/USD. (Well, it seems I can attach only one chart with one post, so, I am sticking with H4 chart with this post. And posting other charts individually following this post.
We have a position opened Long at 13 Apr of 0.5 lot (50 Oz.) at 1288.44 with an expectation of getting the price to test 1307 level. But the position has been capped by the high of 1292 level. A correction to the upper trendline at around 1266 seemed to be valid at that time. I waited for the price to retrace back to 1266. Until then I was within the threshold of USD 20 drawdown. But the trendline couldn't hold the price and got violated, been broken and retested (failure) by this time. This triggered to open a hedge position at 1262.65. I am expecting to the price to test the lower trend line at around 1240 level. When (and if) the price gets there and looking at the sentiment at that level, I'd close the hedge position taking profit and let the price retrace back towards upside cutting down the loss we would have been bearing for the opened postion at 1288.44.
Why I think the price would move up and the retracement is temporary ? If we look at the Weekly and Daily charts, we can see the symmetrical triangle is broken. The price tends to test back the recently broken side of the triangle and we should observe some consolidation in that area. Once consolidation gets over, the price should resume in the direction of trend. Well, all of these are technical aspects, I can not assume the exact effects of psychological forces those are in talk these days, the Brexit and North Korea testing its nukes, continually increasing the threats.
My view could be totally wrong, we all know, no one knows the market and what would it do next for sure. We all use different methodologies to try to understand what it is doing and will do next and we just wait for its moves. The only thing we ca do for sure is to manage our risks so that we take the least of the beatings just in case.

Trade Happy, Trade Safe :)
Ramesh Poudyal
Added topic Code needed to stop opening position
Hi, I have a trend following EA. It seems to work fine except for one problem. And that is, with given conditions it opens position at the end of the trend as well as it does along the way and gets trapped in a drawdown. I was wondering if there is
Ramesh Poudyal
Ramesh Poudyal
Hi Everyone :) ,
It has been quite some time I was away from this place. Today I somehow bumped back to here and feeling awesome again to be back with you guys.
I've published my Meta Trader 4 signal PathivaraInvestment today, feeling very much excited about it as well, I hope and request everyone to at least check this one out and comment/ advise me.
Ok.. What else ?? Well, here is how I am looking at the USDX (US Dollar Index) as of now. All of you guys doing analysis should know its correlation with USD related instruments. Looking at the chart it clearly is in uptrend since May 2016. But at this point it seems as if it is time for a little correction.. what do you think ? If it continues to correct itself, will it be back down to 23.6 % fib retracement level at 99.14 or even further !! Well it depends on the market momentum and time, as we all know. Anyway, if it further corrects back down EUR/USD, GBP/USD, Spot Gold (XAU) (these are the ones in my portfolio, as I mentioned earlier, it should have an impact on all instruments correlated to USD) should have advantage. Gold is already trading in a range of 1160 and 1180 since 01 December, despite having a downside pressure, it is kind of holding in-between these levels (probably cause of this USDX weakness for now). Another major factor for Gold's momentum, The Fed's Fund Rate announcement is due on 13/14 December 2016. The price sure will be volatile during that period.
Ramesh Poudyal
Ramesh Poudyal
What do you guys think Gold is doing ?
Ramesh Poudyal
Ramesh Poudyal
21 April, Monday
Soon as market opened today after long weekend break, European and British banks are still close today, price slid USD 13 per ounce from USD 1298 to USD 1285. A flag pattern in M30 chart is broken on downside. According to the rule, the price should now move down towards USD 1263, USD 37 per ounce, the length of the flag pole from the point which it was broken at around USD 1300. Technically, 1280/1278 must provide a good support as it had on around 1st April from where it rallied to USD 1330. If it does so, we may see a correction up ahead and will have to reassess sentiment along with, keeping the fundamental of Ukraine and Russian tension growing. The above mentioned support levels are also important in the meaning that the price is currently trading at USD 1285, a 150 SMA Daily.
Looking at the daily chart, unless the above mentioned supports hold, it doesn't feel good for Bulls.
Trade Happy, Trade Safe :)
Francis Dogbe
Francis Dogbe 2014.04.21
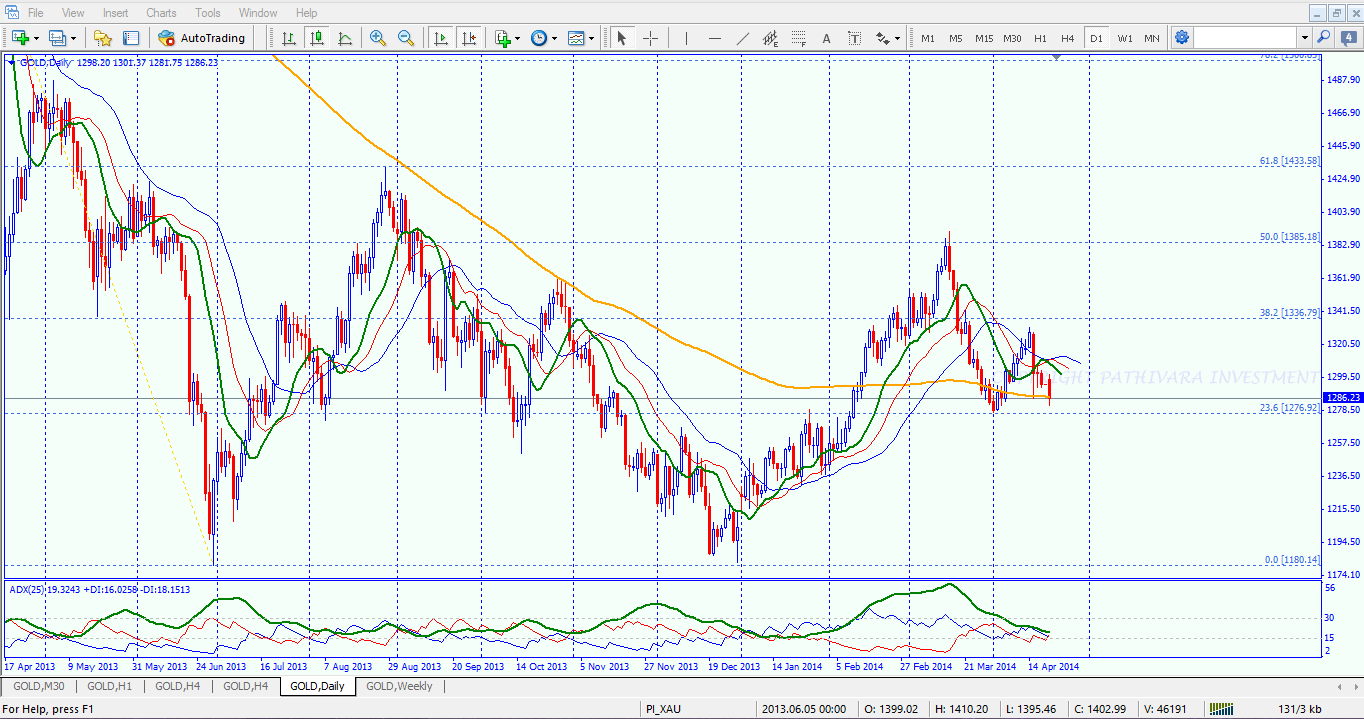
Can you explain why you use ADX(25) instead of ADX(14)......any special reason?
Ramesh Poudyal
Ramesh Poudyal 2014.04.21
Hi Francis, there is no any particular reason other than just it is kind of consistent with trend and my personal preference. If 14 instead of 25 and even lower values than 14 are used, the ADX reacts even for smaller trends which are kind of hard to confirm, and if higher than 25 are used it kind of becomes slow with even a profitable trade. So, like I said it is just my personal preference, the way I look and see the charts.
Ramesh Poudyal
Ramesh Poudyal
11 April, Friday
Gold closed higher yesterday at 1318.64 after testing a high of 1324.30, breaking the channel into play since 08 Apr at 1313 (can clearly be seen in H1 Chart). If the current level of 1321/24 clears, the next level on test would be 1336.79 (38.2% Fib of the fall from 1590.23 to 1180.24). Level 1334 is as well 50% Fib retracement of recent fall off 1392 to 1276, so this level would be of some importance, as a next resistance and if breached and held, a support to test further up.
Looking at the USD Index (USDX) at 5H chart at Investing.com, there has been a support at 79.40 area in 18 March from where it bounced off to the high of 80.76 from where it fell in past couple of days t test this support once again. Long as this support holds, chances are it would bounce back up, this view is supported by a slight divergence in RSI which has now made a lower low but index is supported by previous support preventing it from falling further low with the RSI. Taken this into account if the index moves up, chances are gold may correct somewhat from the current level of 1320. This view is supported technically by the 150 SMA in H4 as of now acting as a resistance, which it previously did on March20/21 at 1339 level. If a correction comes into play, it must be supported and held by 1307/08 level in order to continue further up ahead to test higher towards 1339 once again.
Bottom line, long as supports 1307/08 and 1276 holds, we are bullish gold with a possible correction up ahead.
Trade Happy, Trade Safe :)
Ramesh Poudyal
Ramesh Poudyal
21 March Friday
Technically, looking at the chart, price is clearly in the Bear's territory. But the way level 1320 held and denied a test below it gives some hope and possible early signal of price now turning upside. The way Chikou Span is held by the 150 SMA is another fantastic view in this chart. If 1336 is cleared, the price pretty much would be trading above the 150 SMA as well, and looking at the RSI, if sentiment remains same, further higher tests could be seen.
But a break of support 1320 should take the price to next level of 1312, the 38.2 % retracement of 2014 uptrend followed by 1298.
Trade Happy, Trade Safe :)
Ramesh Poudyal
Registered at MQL5.community