Divergence between market conditions and indicators
As I understand your correctly - you are trading on M5 timeframe and the signals are received from H1 timeframe, right?
If yes so ... most EMA crossing systems/signal systems etc are using the "trading on close bar" method - it means: we are waiting when the bar with the signal is closed, and we open the trade on new bar if the previous close bar is still having the signal.
You told that "the MACD histogram begins to turn upward, in combination with price being above EMA 8 and EMA 8 above EMA 34" ... on open H1 bar or close H1 bar?
- Because if on open H1 bar so this bar is continuing painting with the trading signal which may be changed (buy trading signal to no signal for example), and M5 is the part of open H1 ... because of one hour and 5 minutes for same price ...
- If on close H1 bar so it may be too late to use M5 ...
Anyway, if your system is "trading H1 indicators' signals on M5 chart" so it is MFT system (with a lot of false signals but it may be profitable in general for many pairs trading in sinultanious way for example).
-----------------
But I am not sure that I understood your post in right way sorry ...
You are correct, I am trading M5 based on H1 signals. I wait until the H1 candle has closed, so as to confirm the signal. Then I look for the correct entry point on M5.
What I have thought is that once I get a signal on H1, I should wait for a pullback on M5 - but wait for the pullback itself to begin reversing, so that I know that it is returning to the trend.
Also, what does MFT stand for?
MTF is multi-timeframe.
It is your case: trading on lower timeframe by higher timeframe signal; or tradin on one timeframe by taking the signals from the other timeframe.
Usually, the traders are using mnay pairs to trade in MTF trading system ... why? just to get one trade for at least for a week for example ... and they are using EAs for that.
They are getting good profit but with big drawdown (and the risk for such the systems are similar to martingale systems).
-------------------
Some people are estimating the market condition on D1 in the morning (they call it 'technical analysis'), and open trade on any preselected timeframe (M5 or any) taking the D1 market condition onto consideration during a day. That is what technical analysis is used for.
You are correct, I am trading M5 based on H1 signals. I wait until the H1 candle has closed, so as to confirm the signal. Then I look for the correct entry point on M5.
What I have thought is that once I get a signal on H1, I should wait for a pullback on M5 - but wait for the pullback itself to begin reversing, so that I know that it is returning to the trend.
Also, what does MFT stand for?
MFT stand for multi time frame, some traders look at various time frame, for example weekly, daily, H4, H1, 30min, 15min etc for market trend/condition analysis before execute buy/sell order.
Thanks!
What system would you suggest that has less drawdown? Or is there a way to regulate this system so as to decrease the risk?
This is the example of MTF EA - this is old EA but I used those EAs for trading for more than 1 year.
You can read this old threads for example (EAs can be improved in Freelance according to your system taking this EA as 'template' for account protection features for example):
This is the next MTF EA (we can use this EA as a template too to insert any system to be inside the code instead of the system coded there):
Electra EA ** ReleasedFor me there's nothing wrong using moving averages and MACD together, in fact this classic trading system working well if we can utilize its potential usage and on higher time frame.
Example chart 1 hour AUD/USD :
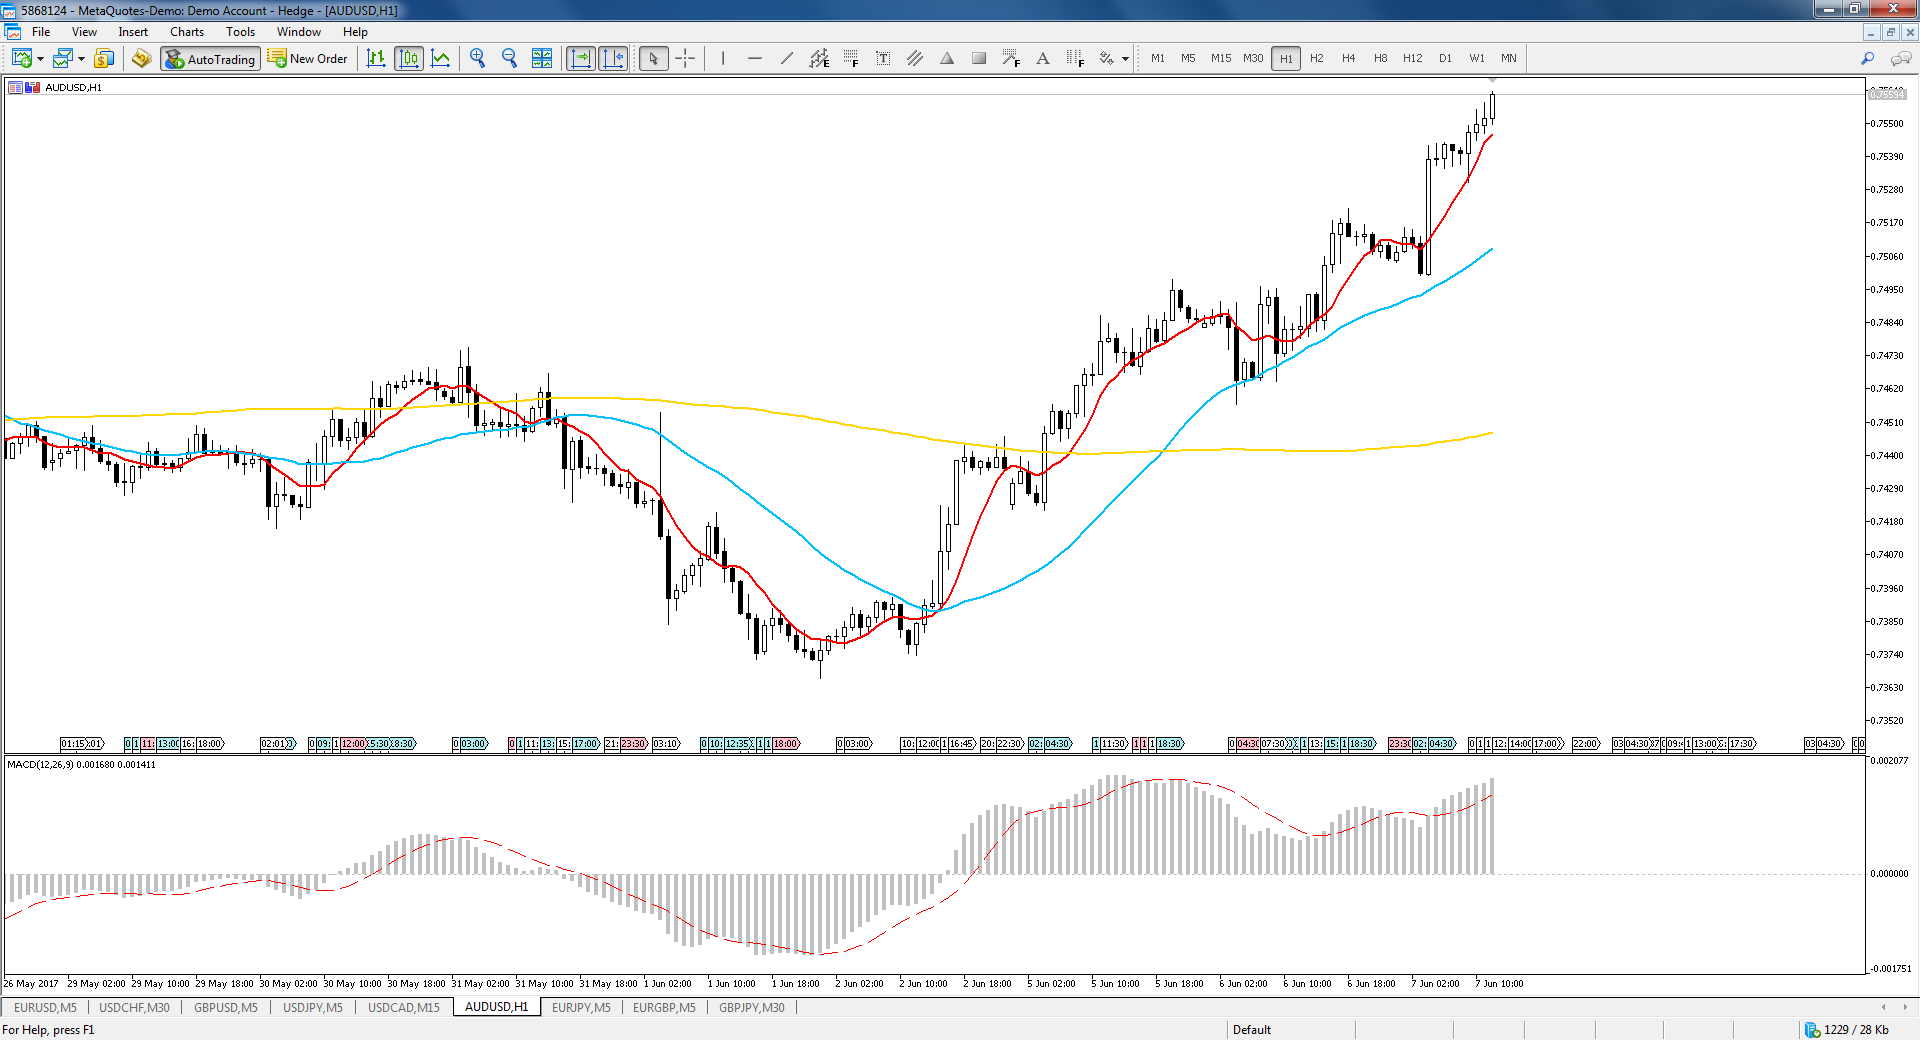
So if we look at the AUDUSD 1 hr chart, i use 1 hr chart since in your 1st post you are using as main. Now candlestick moving above 8 /34 /200 MA, and the MACD also in bullish signal. In 5 min chart, as entry chart, we need to look for buy entry with low risk entry, and also enter on which session? London? New York?
Example 5 min chart with 34 MA and Stochastic :
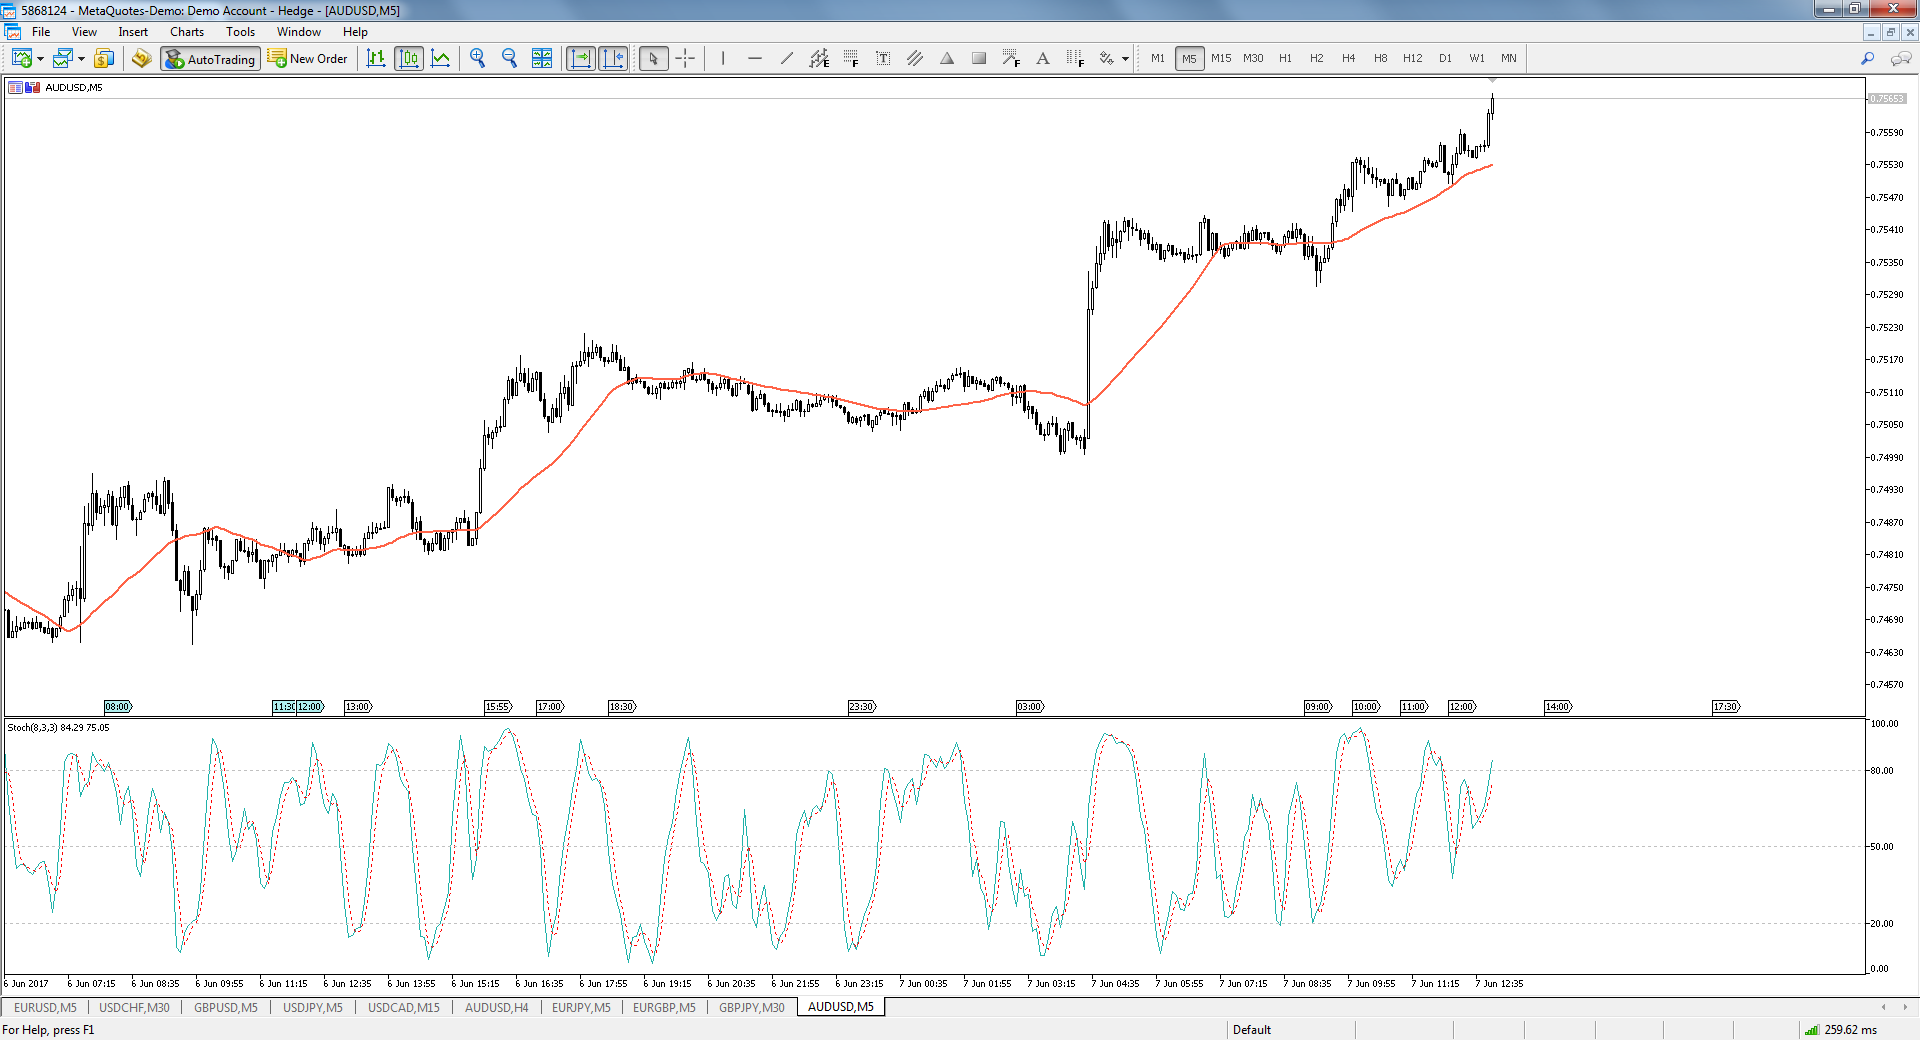
The above chart just example or if i want to look for buy entry, candle open/move above 34 MA and stochastic above 50 level. While sell entry candle open/move below 34 MA and stochastic below 50 level.
This is only example but you can fine tune your entry setup according to your risk management.
- Free trading apps
- Over 8,000 signals for copying
- Economic news for exploring financial markets
You agree to website policy and terms of use
Good day!
I am curious as to whether anyone else is in the same boat as me. After some research I have decided to use a combination of and EMA trading system and a MACD trading system, yet it seems to me (despite backtesting saying the system should work) to be flawed somehow.
In my system, I use EMA 8, 34, and 200, along with MACD 12, 26, 9. For a long trade, I look to for a trend on the hourly chart when the MACD histogram begins to turn upward, in combination with price being above EMA 8 and EMA 8 above EMA 34. I then look for an entry on the 5min chart, as soon as price pulls back below EMA8. However, the last few times I have done so (most recently AUD/USD bought, which immediately ran straight down to my stop), have failed me.
What am I doing wrong?
B