potential for great ea
One More Thing, It Seems This Trading Method Works Good On Fxopen And Ibfx. It May Work With Other Brokers, But These Are The Two I Use And It Works Great. I Use M15-h4 Time Charts For Reference And Trade In The M3o-h1 Timecharts. The M1-m15 Charts Are A Bit Choppy For This. This Is How I Use It, You Might Find A Better Way That Suits Your Style Of Trading.ALSO THIS INDICATOR WORKS EXCELLENT WITH THIS METHOD OF TRADING
if you use mva as the base and when ema + lmva is above or below the mva, you will get good results as well.. period 14 for all. i use ema period 10 also.
if you use mva as the base and when ema + lmva is above or below the mva, you will get good results as well.. period 14 for all. i use ema period 10 also.
I have never used this system. Willsearch about it it seems as it is a good one.
I may be able to put up a EA for this.
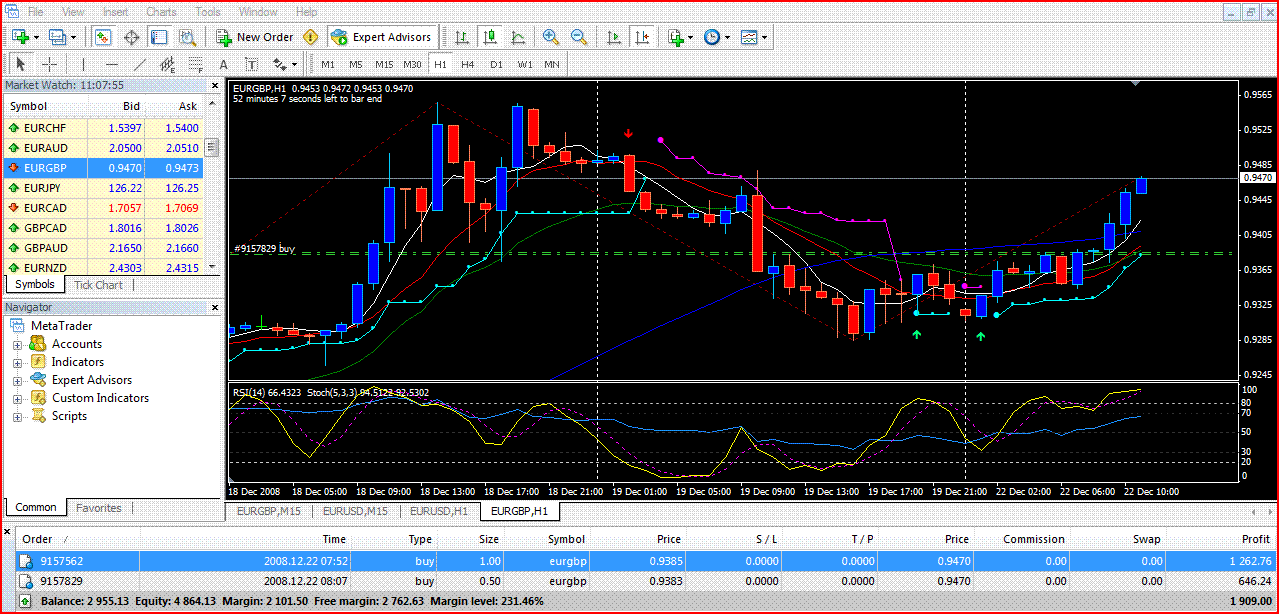
need more info on your exit point - when price line candle touches BOTH EMA 5 and EMA 10 ?
also your entry point -- after the arrow appear and the price chanel stop line
appear ?
- Free trading apps
- Over 8,000 signals for copying
- Economic news for exploring financial markets
You agree to website policy and terms of use
this is my first post on this forum so i figgure i should come out swinging. what i've attached is by no means my work, i found it in the backpages of another forum and belive this to be a very good system. i've attached what i got, including indicators,template,chart set up,and the tutorial. this has worked very well for me.what im wondering is could someone make an EA out of this,if someone has i'd love to find it,if it hasn't i would be greatfull for any help making one,i cant write script trust me i've tried it. any input would be appreciated.
Lets see it in the works.
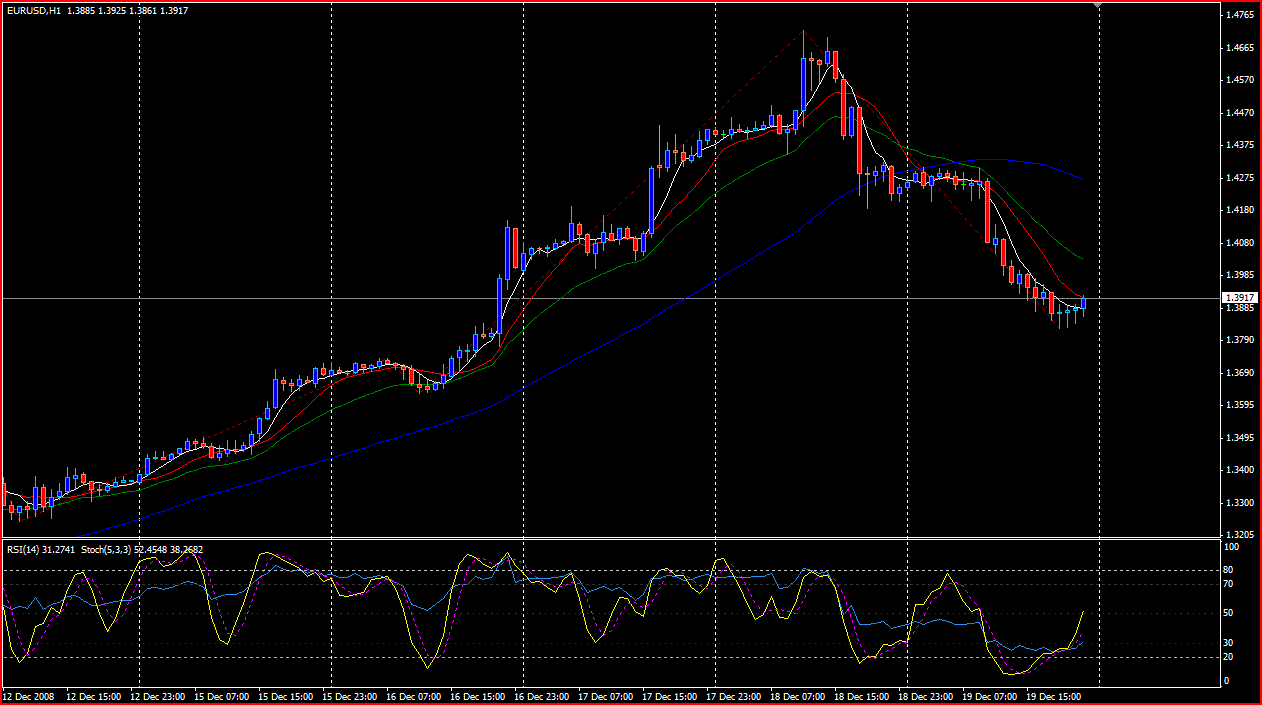
Profit Range: 20 to +300 Pips per trade
It is extremely easy to follow:
Entry Criteria:
- When the white 5 EMA crosses the Red 10 EMA AND: the following requiremets are met:
- RSI has broken over or below 50 (long / short)
- MACD should be over or below 0 (long / short)
- Stochastics are not in an oversold or overbought zone or they have just broken out of an oversold or overbought zone
Exit Criteria:
- When the price crosses the 5 and 10 EMA and RSI is breaking 50
Comments:
In a good trend or short term move the EMAs will line up in this manner from bottom to top (bullish) / reverse for bears
EMA 50
EMA 20
EMA 10
EMA 5
By the time the price breaks 50 EMA you should have long closed your position. Its a matter of a little practice and getting use to and you will be able to determine an optimal exit point based on the crossover on par with the indicators.
The key in trading is to loose all emotion. The best way to do it is to have a mechanical trading system.