Indicators: ParabolicUsMoving
karlson3 #: Hi mate. Thank you very much for this amazing indicator. Is it possible to extend filling color zone to the right of the chart please ? Best regards
Why and how?
There are no data points in the future (to the right). How do you expect them to be calculated?
Or are you just wanting a simple rectangle to fill to the right based on the last values? Why would you want that?
Fernando Carreiro #:
Yes exactly, a simple rectangle to fill to the right based on the last valuesWhy and how?
There are no data points in the future (to the right). How do you expect them to be calculated?
Or are you just wanting a simple rectangle to fill to the right based on the last values? Why would you want that?
It's just a visualisation preference
karlson3 # :
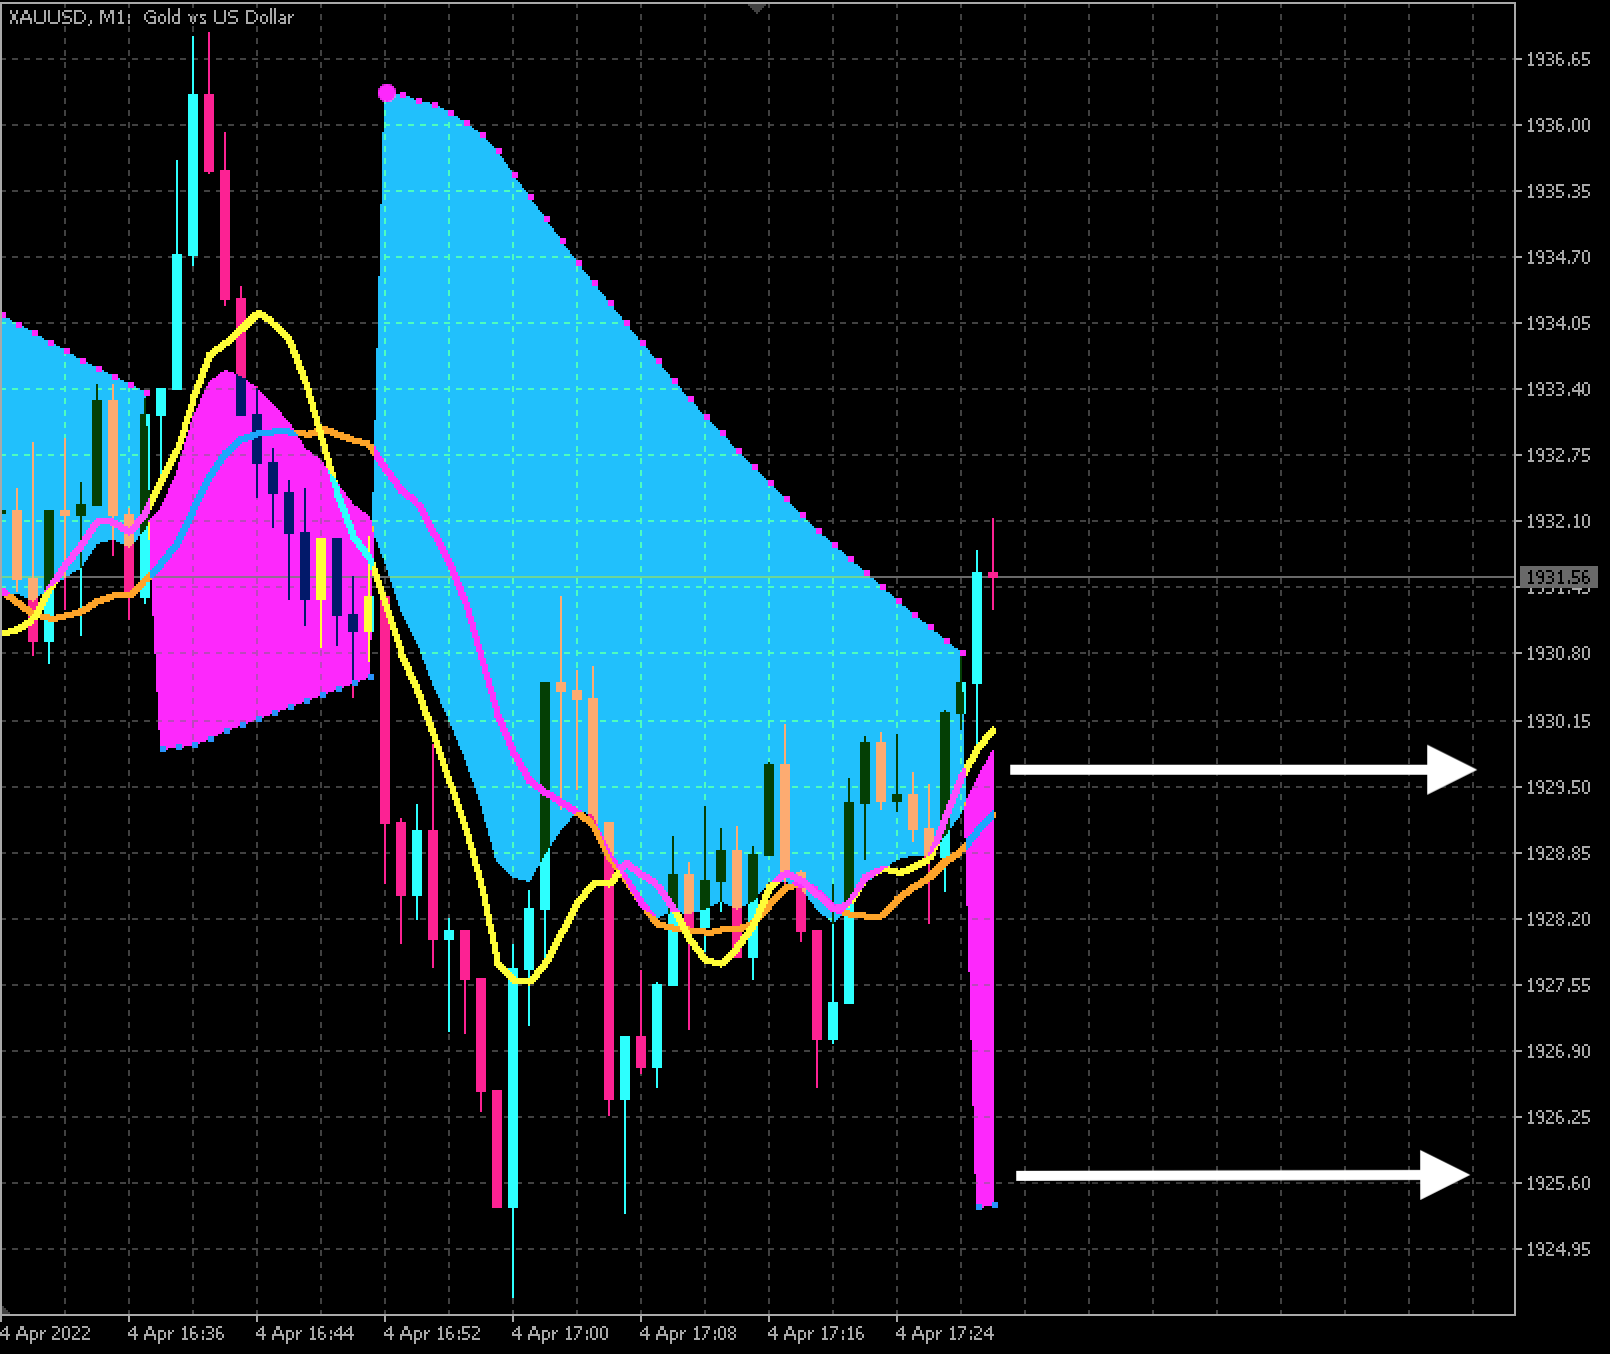
Yes like this
Yes like this
The indicator code is available here: SAR Color Filling Right zone
Thank you! but I need to adapt it to this indicator, too hard for me :(
You are missing trading opportunities:
- Free trading apps
- Over 8,000 signals for copying
- Economic news for exploring financial markets
Registration
Log in
You agree to website policy and terms of use
If you do not have an account, please register
ParabolicUsMoving:
A trend indicator based on the intersections of Parabolic Sar and a moving average.
Author: Nikolay Kositsin