My second idea for an EA
Here are the indicators and image
Actually we are looking a synchronization of the above conditions. The second condition can happen first e.t.c
At the capture image the buy vertical line should be few after because the green line will appear after. Just i wanted to give the basic idea.
If I am correct, "!vertex_mod_3.01"repaints.
According to my observation , you must wait 1-2 candles to be closed, after the purple line still as is. If you are right and repaints i would like to suggest us other indicators for the system my friend.
According to my observation , you must wait 1-2 candles to be closed, after the purple line still as is. If you are right and repaints i would like to suggest us other indicators for the system my friend.
Do you actually trade that system?
yes becoz if u trade with system u must know that which one are repaint and which one are not repaint
If the repaint for you is the last candle for me is not
Even if i want to try a repaint indicator in system, so what? Could be as confirmation indicator. I am asking you if you can help for coding or even to add extra indicators, this is my question in this post.
- Free trading apps
- Over 8,000 signals for copying
- Economic news for exploring financial markets
You agree to website policy and terms of use
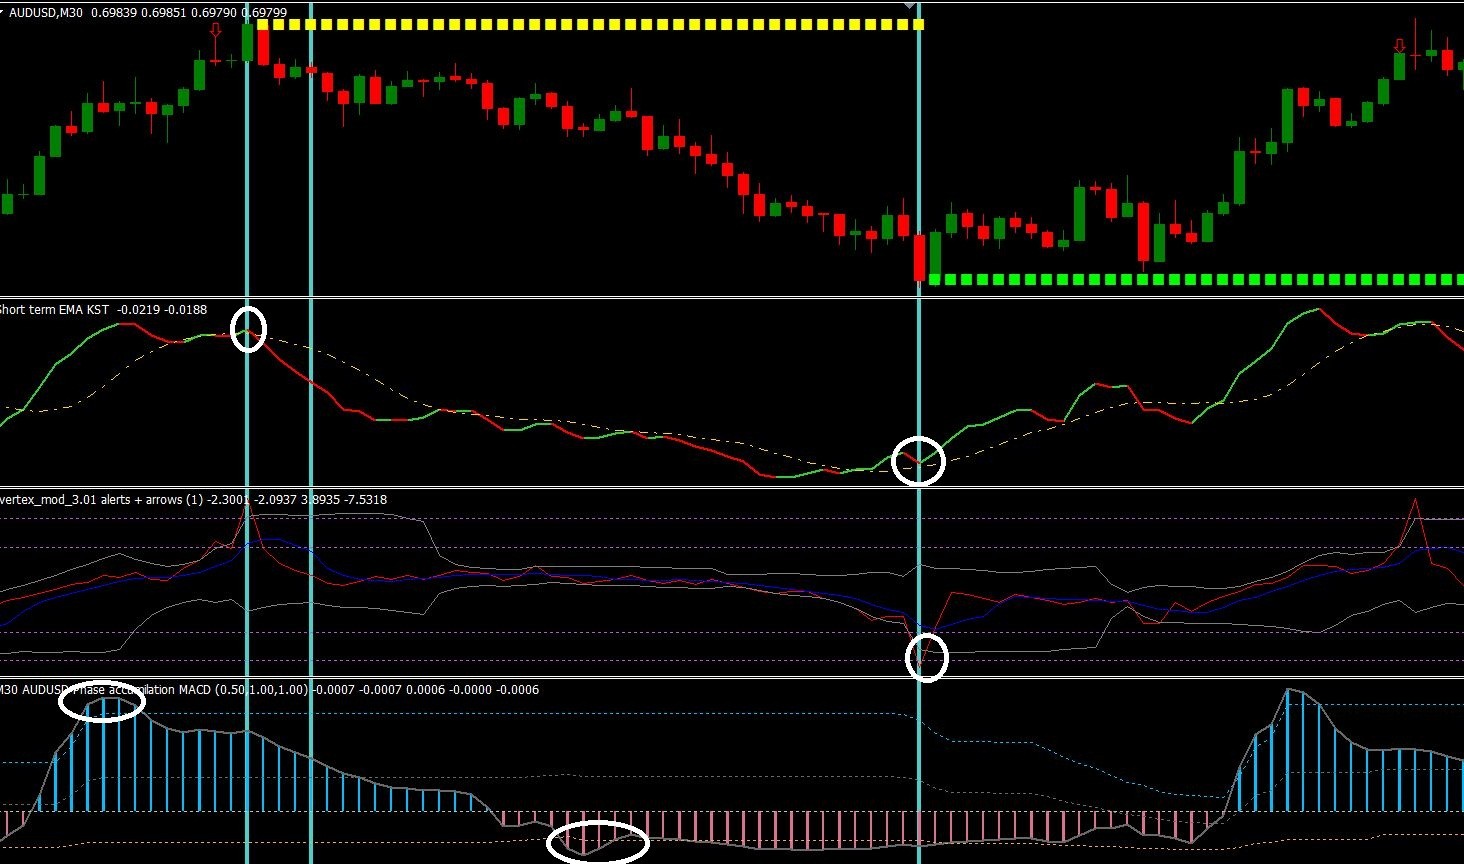
I have a second idea for an EA. Any suggestions and improvements are welcomed.
Sell:
1.) When Resistance yellow line is created (Start of creation ,usually1-4 bars) - I hope to be possible to add this condition
2.) Second indicator as show on image to be sell condition (in short)
3.) vertex indicator to had previously or after touched the +6 or +10 level. Maybe here is good to add the v sigh in programming ex +1candle price+3candle price
4.) before on the chart the phase accumulation MACD had broke from above to below the upper level
5.) Your conditions
Close Sell:
1.) Your Close conditions: An appropriate internal up arrow (example )
2.) Close Sell when Buy Conditions are satisfied below
Buy:
1.) When Support lime line is created (Start of creation ,usually1-4 bars) - I hope to be possible to add this condition
2.) Second indicator as show on image to be buy condition (in short)
3.) vertex indicator to had previously or after touched the -6 or -10 level. Maybe here is good to add the v sigh in programming ex +1candle price>+2candle price & +2candle price<+3candle price
4.) before on the chart the phase accumulation MACD had broke from below to above the lower level
5.) Your conditions
Close Buy:
1.) Your Close conditions: An appropriate internal down arrow (example )
2.) Close buy: when Sell Conditions are satisfied above