15 Min price action pullback system
see this example below
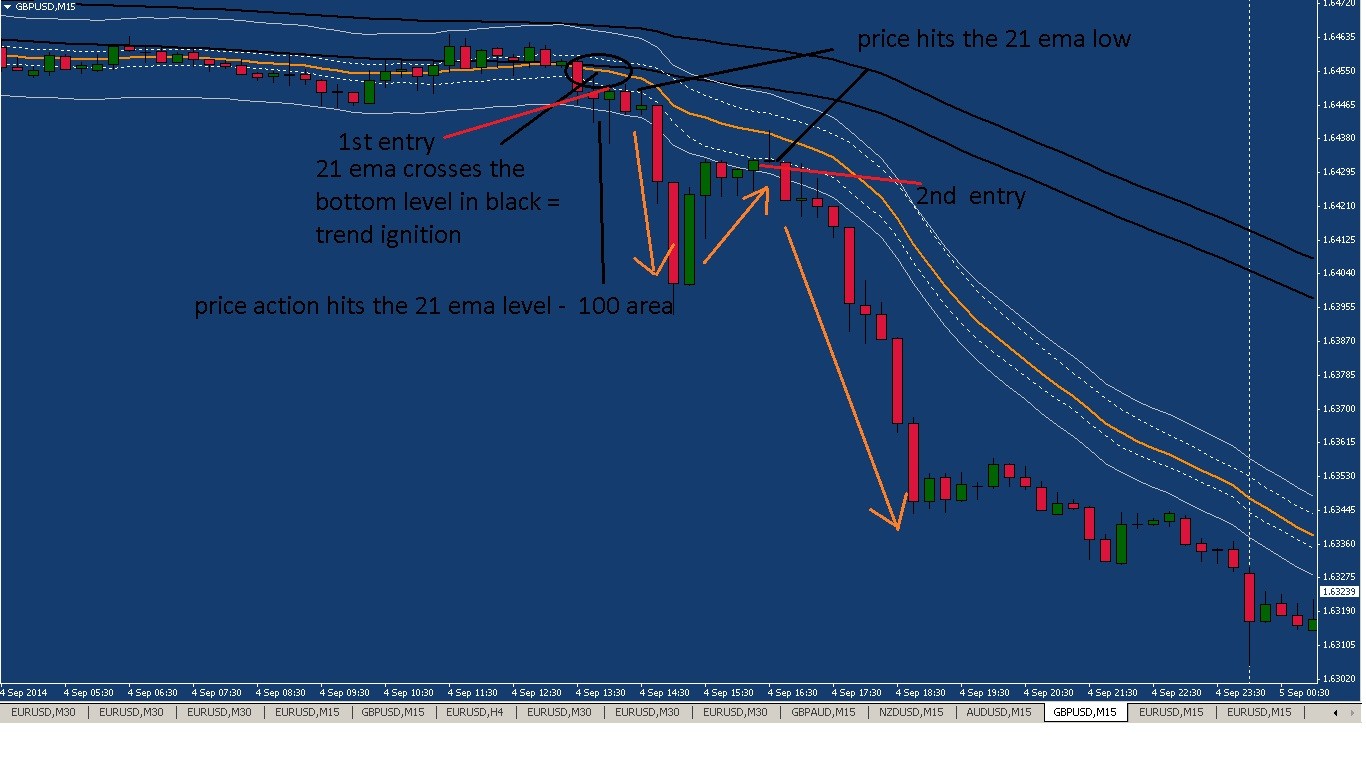
first we see the orange line 21 ema go outside the black channel bottom area this is the first signal
then we see the price hitting the 21 ema - 100 area line , this indicates price action trend
then we see a pullback to the 21 ema low as we are selling , this is the entry area,
stop loss is a candle close above the 21 ema high
hope this clears it up

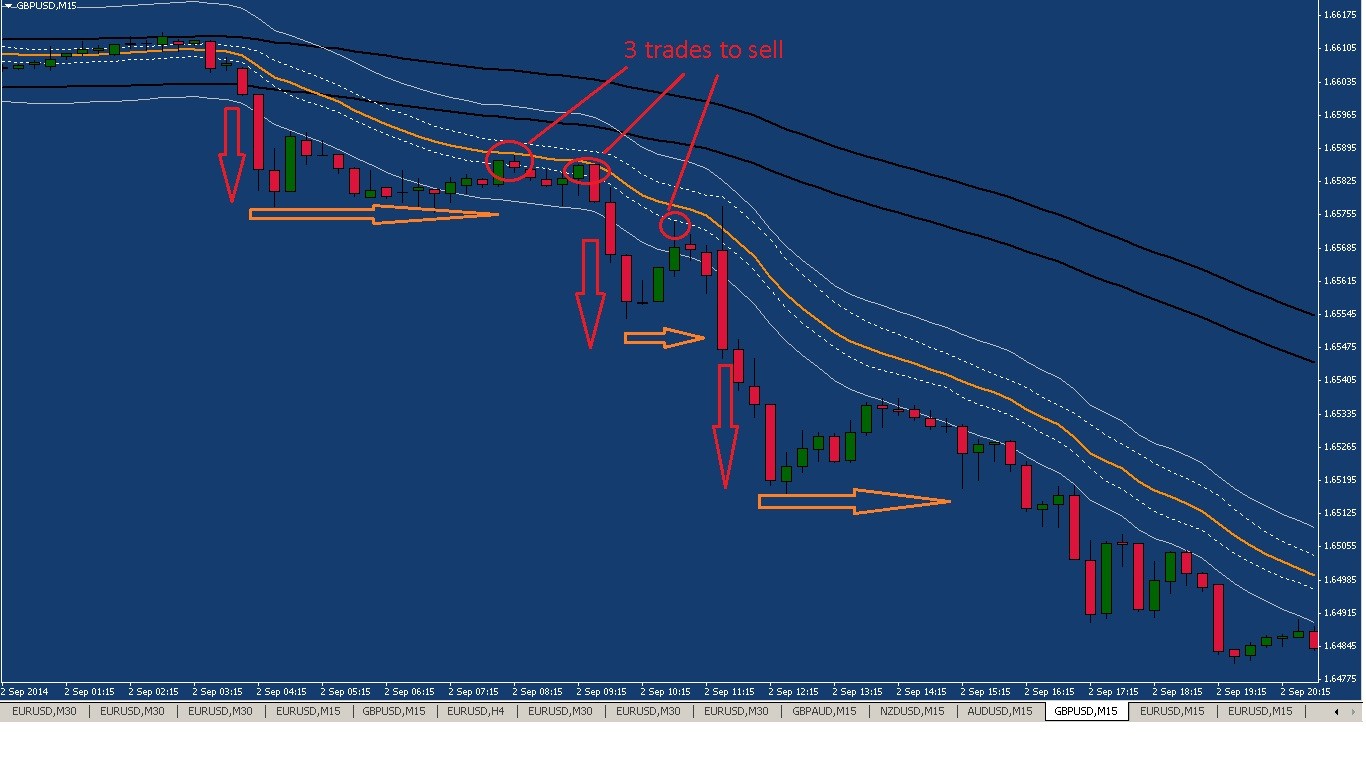
here is another example of when to trade and where to pull the trigger
price action shows its hand , hits the 21 ema -100 level
price hits the 21 ema low , 3 trades to take
simple
15 min price action breakout system
Hi,
I also have a 15 min breakout system if anyone is interested
join me in skype for a chat
my skype name is jamesagnew718
- Free trading apps
- Over 8,000 signals for copying
- Economic news for exploring financial markets
You agree to website policy and terms of use
Hi,
I have created a pullback system for the 15 min time frame, its very easy , rules as follows,
i use 100 ema with levels 50 and -50 and the 21 ema with levels 100 and -100
also use 21 ema high and 21 ema low
this system is easy to understand
when the 21 ema goes outside the 100 ema level 50 or -50 area this is called trend ignition time, we then look for trades,
1) we need to see the price hit the 21 ema , 100 or -100 level, this is the first sign of a trend,
2) we then need a pullback up to the 21 ema low in a sell or 21 ema high in a buy
3) we enter when the price hits the 21 ema high or low depending if we are in a down trend or up trend
4) exit when the price closes the 21 ema high in a sell or exit when the price closes the 21 ema low in a buy
5) take profit is 10 pips
hope you understand what i am sharing , any questions feel free to ask